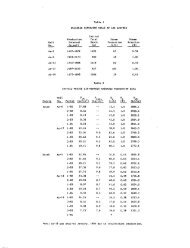
.PUMP CONTDOl. CEOTHERMAL Pnoa MJECTION WELL WELLS a rupture); or a drop in supply temperature (caused by a closed valve or stopped pump). When <strong>the</strong> project is expanded to Phase III, a computerized control center will replace all chart recorders and provide BTU calculations for remote building as well as temperature and pressure <strong>of</strong> heating water supplied and used. PART IV LIFE CYCLE AND COST ANALYSIS For <strong>the</strong> Klamath Falls district, heating <strong>of</strong> <strong>the</strong> central business core Phase.II (<strong>the</strong> elevenblock district) was evaluated due to <strong>the</strong> fact that this phase will be completed in <strong>the</strong> very near future. Cost benefit analysis was based on <strong>the</strong> annual heat load using geo<strong>the</strong>rmal energy.as opposed to natural gas. The economic analysis was based on <strong>the</strong> following assumptions: 1) The economic inflation rate was forecast at 7%. As <strong>of</strong> this writing, 9% would be more accurate. 2) Inflation rates for conventional energy were obtained from <strong>the</strong> Oregon Department <strong>of</strong> Energy as follows: a. natural gas--5.2% above <strong>the</strong> economic inflation rate through 1986 and 1.5% above <strong>the</strong> economic inflation rate <strong>the</strong>reafter. b. electric power—2.5% above <strong>the</strong> economic inflation rate through 1986 and 1.5% above <strong>the</strong> economic inflation rate <strong>the</strong>reafter. T r~ 1 flC-» r--- SXI}J-SH i VJ* • 11 J J r^ ' ^ - . o . — FIGURE 9. Distribution Network Control 393 pRCSsunrzeo T*#«r MEAT EKCHAMGEH/COWTROL BUILOtwC Lund, et. al. 3) Cost <strong>of</strong> capital 6.5% as indicated by <strong>the</strong> City <strong>of</strong> Klamath Falls. 4) Current cost <strong>of</strong> natural gas $0.34394 per <strong>the</strong>rm (rate paid in February, 1979). 5) 85% efficiency for natural gas. These inflation rates have proven to be very conservative. During <strong>the</strong> past 3 years, <strong>the</strong> City has experienced a 26.5% per year increase in <strong>the</strong> cost <strong>of</strong> natural gas as compared to 12.2% in our evaluation. The fact that actual inflation rates exceed those used in <strong>the</strong> study fur<strong>the</strong>r supports <strong>the</strong> arguraent for <strong>the</strong> geo<strong>the</strong>rmal system. Tables I and II <strong>of</strong> <strong>the</strong> report show capital investment for 16 combinations <strong>of</strong> primary and secondary piping systems. Life cycle costs were calculated on <strong>the</strong>se piping systems for a 10-year period and appear in Tables III and IV. A fifty-year life cycle cost analysis was completed on four piping systems and <strong>the</strong> results are illustrated graphically on <strong>the</strong> chart following. Although steel pipe installed in concrete tunnels requires <strong>the</strong> highest capital investment, <strong>the</strong> annual maintenance costs were estimated to be considerably lower. Such a system provides easy access, room for future expansion at minimal cost, and reduces maintenance time and cost particularly in conjested business districts.
Lund, et. al. Ste«) in {«) Tunne\ " « ' lb) Surlal "' (cl Burled Burtea K- StMl In Tunnel (I) 726,463 637,060 l,363.S!3 7?6,«63 490,072 1,216.535 726.463 329,118 1.055,581 726.463 329,12? 1,055,592 TABLE I. TABLE III. Piping Hft^cw., Cost, (In i) Prlurr Supply PipeUne 8- Steel In Tunnel (in 506,175 637,060 1,143,235 506,175 490.072 996,247 5(»,)75 329,118 835,293 506.175 329,129 835,304 ft. 000,000 • prleia ry line COM ooo.ooo • sec<strong>of</strong>wlAry line cost 0,000,000 - Iou1 pipeline cost Co,t figure. Used on J«nu«ry 1979 esiimate,. steel in Tunnel Steel SurieO Flip Surfed AC Surled (a) (6) (O (0) TABLE II, Total Project Cost Prtwry Supply PipeKne 16- Steel in Tunnel (1) 1,730,301 1,990,421 1.583,813 1.821.385 1,422.859 11636.288 i,422,670 1,636,300 8- Steel in Tunnel (11) 1,510.513 1,717,090 1,363,525 1,568,054 1,202,571 1,382,957 1,202,582 1,382,969 16- StMl in Tunnel (III) 471.564 637,060 1,108,624 471.564 490.072 961,636 471.564 329,116. 600,682 471.564 329,129 800,693 16' Steel Burled (111) 1,475,902 1.697,287 1,328,914 1,528,251 1,167.960 1.343.154 1,167,971 1,343,167 000.000 - Basic cost 000,000 - I5X engineering I Inflation costs added Note: Basic cost • Hell costs (5169,772) , pipe costs (Table 7 ) • beat exchanger costs (S197,Soe) B- Steel eurled (IV) 282,154 637j060 919,214 262.154 490,072 772.226 282.154 329,118 611,272 282,154 329,129 • 611.283 8- Steel Buried (IV) 1,286,492 1,479,466 1,139,504 1,310,430 978:550 1,125,332 978,561 1,125,345 394 tr 1 8 9 10 10 »c«« coiT cowwiisa OF pic-wit npnt. vtstcn USI»C CAPITAL WCOKi-l AKD "Jl.VItKAdCE tCSTS • 16 y 243,534 156,574 S 23.334 20.146 12,955 i 1,910 • Steel 2 3 4 5 6 7 B 9 10 in Turnel 416,168 17.299 18,510 19,806 21,193 22,676 24.264 25,962 27,779 29,724 loHl tost 223,388 Present value 143,621 Annual Cquiv, Cost i 21.404 5,tee c S17.6J6 yr 1 18,860 2 20,1.10 3 21.59! 4 23,!04 5 24,721 6 26,452 1 28,304 30,285 3.',4!;5 Tota Cost ^-esen , Value Annual tOuiv, Lost Tola *, Cost Present Value Annual tDui, . Cost ir. Tunnel 511,265 12,054 12.897 13,800 14,766 15,800 16,906 19,089 19,356 29,711 155,6C3 100.069 5 14,913 Annual Co,t 01 Bur •:ed Steel Annua' Lost <strong>of</strong> 16* over steel in Tunnel . Siis. 8- Ste.; yr i 1,458 1,560 yr 1 S 4,901 5,241^ 1,670 3 5,6!3 1,786 I.s;.' 2,045 2,189 4 5 6 7 6.Nt 6,^26 6,877 7,158 8 2,341 3 7,873 9 2,505 9 8,424 10 2.680 10 9.014 67,7«0 43,552 5 6,491 a- Steel fiuried yr 1 510,560 2 11,320 3 12,113 4 12.961 5 ii.ses 6 14,839 7 15,878 8 16,989 9 IS,178 10 19.451 Total Cost 146,181 Present Value 93,984 Annual Coul«. cost 5 14,006 i'«l trVlLif i.,fr §-" Stil! Sur ifi) yr 1 5 685 2 733 3 785 4 840 5 898 6 961 7 1.028 8 1,100 9 1,177 10 1.260 Total.Cost 9,467 Present value 6,085 Anrtuti Equiv, Cost 5 907 Forecasting life cycle costs over a 50-year period leaves much to be desired in regard to accuracy. Data on maintenance costs <strong>of</strong> pipelines for 50 years is not available due to <strong>the</strong> lack <strong>of</strong> experience with such piping systems. Table VI shows a total cost suramary for <strong>the</strong> project. Table V concludes <strong>the</strong> study by comparing <strong>the</strong> annual cost <strong>of</strong>• <strong>the</strong> geo<strong>the</strong>rmal system with <strong>the</strong> annual cost <strong>of</strong> continuing to use natural gas over <strong>the</strong> next 20 years. Using a 6.5% cost <strong>of</strong> capital, <strong>the</strong> present value <strong>of</strong> annual savings exceeds $7,000,000 in 20 years. With a capital investment <strong>of</strong> $2,000,000, payback would occur in less than 7 years. The average annual equivalent cost per <strong>the</strong>rm for <strong>the</strong> 20-year period is $0.29 for geo<strong>the</strong>rmal as compared to $0.94 for natural gas.
- Page 1 and 2: Geol^ertnal Resources Council, TRAN
- Page 3 and 4: silica concentration in a water sam
- Page 5 and 6: Morgan, et at. holes over the anoma
- Page 7 and 8: Morgan, et al. point the gradient b
- Page 9 and 10: Olson, et al of a theoretically gen
- Page 11 and 12: Olson, et al Isherwood, W. F., 1977
- Page 13 and 14: Sun and Ershaghi history matching p
- Page 15 and 16: Sun and Ershaghi eg S o "^ lii z >o
- Page 17 and 18: « •'t Lund. et. al. In general,
- Page 19 and 20: Lund. et. al. FIGURE 3 Production F
- Page 21 and 22: W.:-- Lund, et. al. Since the heat
- Page 23 and 24: Lund, et. al, and temperature in th
- Page 25 and 26: Lund. et. al. of the well with cont
- Page 27: Lund, et, al. special heat resistan
- Page 31 and 32: Lund, et al. 3. 4. References TABLE
- Page 33 and 34: •Edmis-tjon period of time buried
- Page 35 and 36: Edmiston VININI FM (SILICEOUS ASSEM
- Page 37 and 38: Table I. Chemical analyses and calc
- Page 39 and 40: Satkln et al. GEOTHERMOMETRY The te
- Page 41 and 42: Denlinger We modeled the gravity da
- Page 43 and 44: TABLE 3. RESULTS OF MODELING RESERV
- Page 45 and 46: Knirsch Table 1. Continued Location
- Page 47 and 48: Knirsch Spring/Well Edgemont Burlin
- Page 50: Mariner et al. MomfflatI Min H>0^ 1
- Page 54 and 55: Mariner et al. KjRiti/Locit Ion T:i
- Page 57 and 58: Mariner et al. T.ibU' I. CftL'iBlr;
- Page 60 and 61: Mariner et al. Table 2. CoioposltLo
- Page 63 and 64: Mariner et. al. Table 3. Geotherrao
- Page 66 and 67: Mariner et al. Table 3. Geotherraom
- Page 69 and 70: Mariner et al. Table 5. Expected an
- Page 72 and 73: Mariner et al. Table 6. Isotopic da
- Page 75 and 76: Mariner et al. Table 6. Isotopic da
- Page 78 and 79:
Mariner et al. 9 K O Figure 10. 10
- Page 80 and 81:
Mariner, et al. hot springs and sha
- Page 82 and 83:
Mariner et al. Mariner, R. H., Pres
- Page 84 and 85:
BOREHOLE GEOPHYSICAL TECHHIQUES FOR
- Page 86 and 87:
Thick-Body Studies ^ Prior to 1982,
- Page 88 and 89:
J-. - (l.ti.od. Co' FIGURE 4c Downh
- Page 90 and 91:
' X • , methods; and, the anomali
- Page 92 and 93:
Geolhermal Resources Council TRANSA
- Page 94 and 95:
Figure 2. Index map of MCAGCC, Twen
- Page 96 and 97:
SMPERATURE GRADIENTS Temperature gr
- Page 98 and 99:
EOTHEFttVlAL RESERVOIR— FLUID TEM
- Page 100 and 101:
Geolhermal Resources Council TRANSA
- Page 102 and 103:
Geology ((aJMG) within the Napa Val
- Page 104 and 105:
^C Bomw of (tw VaAmf Figure 4. Tril
- Page 106 and 107:
Geolhermal Resources Council. TRANS
- Page 108 and 109:
Geophysical studies by Youngs and o
- Page 110 and 111:
feothermal aquifer into a zone of i
- Page 112 and 113:
INTRODUCTION Geothermal Resources C
- Page 114 and 115:
do not become isothermal or have ne
- Page 116:
the heat flow anomaly predicted fro
- Page 120 and 121:
INTRODUCTION In our experience, all
- Page 122 and 123:
The bo'rehDle" eiectricai, techniqu
- Page 124 and 125:
T1ie Cascades Region For the past t
- Page 126 and 127:
which is the rociprpGal pE resistiy
- Page 128 and 129:
of the .deefjer thermal regime .in
- Page 130 and 131:
Wright et al. vide basic data about
- Page 132 and 133:
training and experience in each of
- Page 134 and 135:
Thermai genesis of dissGlution cave
- Page 136 and 137:
JEWEL CAVE THERMAL GENESIS OF DISSO
- Page 138 and 139:
the Soviet Union), however, where K
- Page 140 and 141:
SiKiype THERMAL GENESIS OF DISSOLUT
- Page 142 and 143:
sed onto a longer term lowering are
- Page 144 and 145:
Ceothermal Resources Council RADON
- Page 146 and 147:
^H—^ ^ * I SAN IGNACtO O o V ' o
- Page 148 and 149:
GUTIERREZ-NEGRIN This geothermal zo
- Page 150 and 151:
GOSNOLD TEMPEiRAVURc (Doq. C) FIGUR
- Page 152 and 153:
GOSfJCLD bas(?raent. radioactivity
- Page 154 and 155:
GOSNOLD Sass, J.H., and Galanis, S.
- Page 156 and 157:
Corbaley and Oquita 50 sos+cr 4. -f
- Page 158 and 159:
Ctorbaley and Oquita "The combined
- Page 160 and 161:
JANIK ct al. Old Fort Road valley,
- Page 162 and 163:
JANIK et al. with a cold water at a
- Page 164 and 165:
JANIK et al. — Pilncipal hot-w«l
- Page 166 and 167:
DIRECT HEAT APPLICATION PROGRAM SUm
- Page 168 and 169:
TABLE OF CONTENTS Special Session A
- Page 170 and 171:
Special Session/Agenda (continued)
- Page 172 and 173:
DIRECT HEAT APPLICATION PROJECTS Th
- Page 174 and 175:
Institutional Heating Systems 1 Nav
- Page 176 and 177:
00 t Agribusiness 1 Utah Roses —
- Page 178 and 179:
DIRECT HEAT APPLICATIONS PROJECT DE
- Page 180 and 181:
Commercial Prawn Farm Project Page
- Page 182 and 183:
Boise City Project Page 2 Project D
- Page 184 and 185:
Project Title: City of El Centro Ge
- Page 186 and 187:
City of El Centro Project Page 3 St
- Page 188 and 189:
Elko Heat Company Project Page 2 Sy
- Page 190 and 191:
Philip School Project . Page 2 Proj
- Page 192 and 193:
Project Title: Geothermal Energy fo
- Page 194 and 195:
INJ EAST - WEST DIAGRAMMATIC CROSS
- Page 196 and 197:
.TO CC> ;i'iLjS^" •
- Page 198 and 199:
o EXISTING FACTORY A UNION aoiiER I
- Page 200 and 201:
Kelley Hot Springs Agricultural Cen
- Page 202 and 203:
Project Title: Klamath Falls YMCA 1
- Page 204 and 205:
Project Title: Klamath Falls Geothe
- Page 206 and 207:
Klamath Falls Project Page 3 Status
- Page 208 and 209:
Madison County Project Page 2 Statu
- Page 210 and 211:
Monroe City Project Page 2 Status:
- Page 212 and 213:
Navarro College and Memorial Hospit
- Page 214 and 215:
Ore-Ida Foods Project Page 2 A seis
- Page 216 and 217:
Pagosa Springs Geothermal Project P
- Page 218 and 219:
Moana KGRA Project Page 2 Fracture
- Page 220 and 221:
Project Title: Geothermal Applicati
- Page 222 and 223:
'4 ]^ W^^ '!-/..-'
- Page 224 and 225:
Project Title: Susanville Energy Pr
- Page 226 and 227:
Susanville Energy Project Page 3 Th
- Page 228 and 229:
] ^ ITffl^SSH '(gSPW-
- Page 230 and 231:
THS Memorial Hospital Project Page
- Page 232 and 233:
Utah Roses Project Page 2 Project D
- Page 234 and 235:
Utah State Prison Project Page 2 On
- Page 236 and 237:
Warm Springs State Hospital Project
- Page 238 and 239:
Appendix 1 (continued) Industrial P
- Page 240 and 241:
Appendix I (continued) Industrial P
- Page 242 and 243:
Appendix 1 (continued) industrial P
- Page 244 and 245:
^ Appendix 1 (continued) Industrial
- Page 246 and 247:
1. PROJECT SUMMARY - JUNE 1987 1.1
- Page 248 and 249:
1. k. 1. m. Name Date Nature Gib Co
- Page 250 and 251:
Name Date Nature m. Kevin Fisher 6/
- Page 252 and 253:
3. GEOTHERMAL PROGRESS MOMITOR 3.1
- Page 254 and 255:
g. If a new or amended Geothermal D