- Page 1 and 2:
2011 QCD and High Energy Interactio
- Page 3 and 4:
Proceedings of the XLVIth RENCONTRE
- Page 5 and 6:
2011 RENCONTRES DE MORIOND The XLVI
- Page 7 and 8:
Foreword Contents 1. Higgs Searches
- Page 9:
1. Higgs
- Page 12 and 13:
95% CL Limit/SM 10 1 Tevatron Run I
- Page 14 and 15:
Events/5 GeV 6 10 5 10 4 10 3 10 2
- Page 16 and 17:
Events / 0.5 CDF Run II Preliminary
- Page 18 and 19:
For the most sensitive sub-channel
- Page 20 and 21:
Table 1: Table listing the various
- Page 22 and 23:
various SM Higgs mass hypotheses. T
- Page 24 and 25:
constraints on parameters are given
- Page 26 and 27:
Figure 2: Invariant mass of the ele
- Page 28 and 29:
Figure 4: CDF Exclusion limits for
- Page 30 and 31:
Table 1: Main phases of 2010 commis
- Page 32 and 33:
Table 4: Parameter list for early (
- Page 34 and 35:
luminosity of 1.2×10 33 cm −2 s
- Page 36 and 37:
2 QCD Analysis settings HERA PDFs a
- Page 38 and 39:
min 2 - 2 20 15 10 5 0 H1 and ZEUS
- Page 40 and 41:
SM σ / σ 95% CL Limit on 3 10 2 1
- Page 42 and 43:
NNLO σ/ σSM 95% CL Upper Bound on
- Page 44 and 45:
the report of this working group. I
- Page 46 and 47:
2.3 The impact of different PDF par
- Page 49 and 50:
SUSY Searches at the Tevatron Ph. G
- Page 51 and 52:
on the quality (loose or tight) and
- Page 53 and 54:
SUSY searches at ATLAS N. Barlow, o
- Page 55 and 56:
channel. These results are combined
- Page 57 and 58: Figure 2: The top left plot shows t
- Page 59: 2010 data. Analysis techniques for
- Page 62 and 63: as main discriminator between event
- Page 64 and 65: sign leptons is particularly intere
- Page 66 and 67: N of events 5 10 DATA 10 4 3 10 10
- Page 68 and 69: ) [pb] ν e → B(W’ × σ 10 1 -
- Page 70 and 71: 2 Searches in the dijet final state
- Page 72 and 73: ing that the neutrinos were the onl
- Page 75 and 76: The Quasi-Classical Model in SU(N)
- Page 77 and 78: g (γ µ kµ) γ µ Aa µ g (pk)
- Page 79: 3. Top
- Page 82 and 83: of their vertex with respect to the
- Page 84 and 85: of about 9%. 3.1 Differential Cross
- Page 86 and 87: Figure 5: Summary of most recent CD
- Page 88 and 89: the minimum number of jets identifi
- Page 90 and 91: where f’s are probability functio
- Page 92 and 93: hood technique, with a simultaneous
- Page 94 and 95: momentum direction of the b quark f
- Page 96 and 97: Events 200 150 100 50 -1 DØ L=5.4
- Page 98 and 99: after all corrections in the M t¯t
- Page 100 and 101: for prompt J/ψ under the fully tra
- Page 102 and 103: 2 Events / 20 MeV/c 50 40 30 20 10
- Page 104 and 105: ATLAS - consists of four parts (mon
- Page 106 and 107: 5 D mesons High cross-sections of D
- Page 110 and 111: GeV) μ |
- Page 113 and 114: HEAVY FLAVOUR IN A NUTSHELL Robert
- Page 115 and 116: Figure 1: Overlapping constraints o
- Page 117 and 118: Figure 3: Constraints on new physic
- Page 119 and 120: RECENT B PHYSICS RESULTS FROM THE T
- Page 121 and 122: (IP) distributions are fitted separ
- Page 123 and 124: decays CDF extracts Using a 5.94 fb
- Page 125 and 126: Search for B 0 s → µ+ µ − and
- Page 127 and 128: Ref. 10,11 . The expected GL distri
- Page 129 and 130: IN PURSUIT OF NEW PHYSICS WITH B DE
- Page 131 and 132: τK + K −/τBs 1.01 1.00 0.99 0.9
- Page 133 and 134: CHARMLESS HADRONIC B-DECAYS AT BABA
- Page 135 and 136: surements (fL ∼ 0.5). Several att
- Page 137 and 138: Estimating the Higher Order Hadroni
- Page 139 and 140: the resulting exponent suggests to
- Page 141: The counterpart of the ground-state
- Page 144 and 145: (a) Tree level signal decay b ¯Bs
- Page 146 and 147: the B0 d system LHCb profits from i
- Page 148 and 149: This result is based on averaging o
- Page 150 and 151: y non-perturbative effects. Using t
- Page 152 and 153: e M(Dπ) distributions obtained D +
- Page 155 and 156: CHARM PHYSICS RESULTS AND PROSPECTS
- Page 157 and 158: LHCb is working towards its first m
- Page 159 and 160:
Two body hadronic D decays Yu Fushe
- Page 161 and 162:
where the effective coefficients aA
- Page 163:
6. J. J. Sakurai, Phys. Rev. 156, 1
- Page 166 and 167:
states: 6π, 2K4π, 4K2π, KSK3π 1
- Page 168 and 169:
egion of X(3872), which corresponds
- Page 170 and 171:
Figure 1: The π 0 recoil mass spec
- Page 172 and 173:
η → π + π − π 0 η ′ →
- Page 174 and 175:
conservation. This second principle
- Page 176 and 177:
many of them come from gluon nonper
- Page 179 and 180:
Latest Jets Results from the Tevatr
- Page 181 and 182:
in for the inclusive trijet event s
- Page 183 and 184:
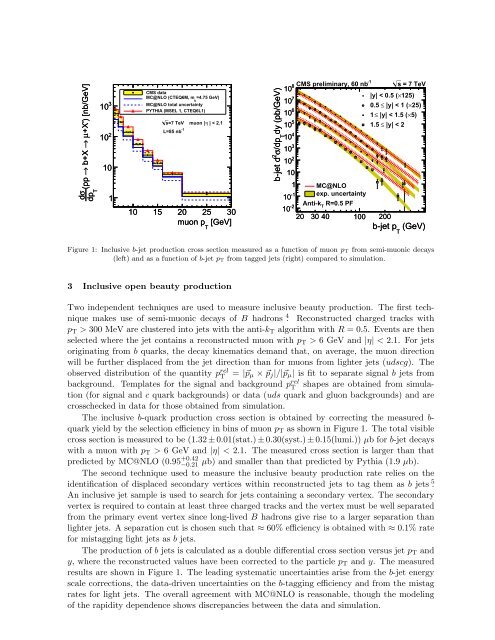
RECENT RESULTS ON JETS FROM CMS F.
- Page 185 and 186:
dy (pb/GeV) /dp 2 d 10 10 10 9 10
- Page 187 and 188:
RECENT RESULTS ON JETS WITH ATLAS G
- Page 189 and 190:
| y| < 0.3 ATLAS Preliminary 2.1 <
- Page 191 and 192:
EPOS 2 and LHC Results TanguyPierog
- Page 193 and 194:
positions are randomly distributed
- Page 195 and 196:
ABOUT THE HELIX STRUCTURE OF THE LU
- Page 197 and 198:
Figure 2: Left: Correlations betwee
- Page 199 and 200:
Improving NLO-parton shower matched
- Page 201 and 202:
due to the inclusion of higher orde
- Page 203 and 204:
New Results in Soft Gluon Physics C
- Page 205 and 206:
Figure 2: Spacetime depiction of Dr
- Page 207 and 208:
Central Exclusive Meson Pair Produc
- Page 209 and 210:
in the CEP cross section. However i
- Page 211 and 212:
AN AVERAGE b-QUARK FRAGMENTATION FU
- Page 213 and 214:
1/N dN/dx 3.5 3 2.5 2 1.5 1 0.5 ALE
- Page 215 and 216:
W + W + jj at NLO in QCD: an exotic
- Page 217 and 218:
Σ fb Σ fb 3.5 3.0 2.5 2.0 0.65 0.
- Page 219 and 220:
W/Z+Jets and W/Z+HF Production at t
- Page 221 and 222:
Figure 2: Measured inclusive jet di
- Page 223 and 224:
W and Z physics with the ATLAS dete
- Page 225 and 226:
SHERPA 9 MC generators but not by P
- Page 227 and 228:
W/Z + Jets results from CMS V. CIUL
- Page 229 and 230:
Events / 0.1 600 500 400 300 200 10
- Page 231 and 232:
TEVATRON RESULTS ON MULTI-PARTON IN
- Page 233 and 234:
iterative midpoint cone algorithm w
- Page 235 and 236:
INVESTIGATIONS OF DOUBLE PARTON SCA
- Page 237 and 238:
¦ § ¦ ¨ ¥ ¦ ¨ § ¦ © ¦ §
- Page 239 and 240:
Figure 4: Two-dimensional distribut
- Page 241 and 242:
SOFT QCD RESULTS FROM ATLAS AND CMS
- Page 243 and 244:
as a function of multiplicity for t
- Page 245 and 246:
Determination of αS using hadronic
- Page 247 and 248:
α S (m Z 0) 0.15 0.14 0.13 0.12 0.
- Page 249 and 250:
Reaching beyond NLO in processes wi
- Page 251 and 252:
dσ/dp t,max [fb/GeV] 10 5 10 4 10
- Page 253 and 254:
Nonlocal Condensate Model for QCD S
- Page 255 and 256:
The lower bound for the integration
- Page 257 and 258:
AN ALTERNATIVE SUBTRACTION SCHEME F
- Page 259 and 260:
where MBorn,g is the underlying Bor
- Page 261 and 262:
THE NNPDF2.1 PARTON SET F. CERUTTI
- Page 263 and 264:
ottom masses mb of 4.25, 4.5, 5.0 a
- Page 265 and 266:
HOLOGRAPHIC DESCRIPTION OF HADRONS
- Page 267 and 268:
∫ SYM = κ d 4 ( 1 xdzTr 2 h(z)F
- Page 269 and 270:
Nuclear matter and chiral phase tra
- Page 271 and 272:
fact that for Nc ≫ 3 a gas of fre
- Page 273 and 274:
Recent Results on Light Hadron Spec
- Page 275 and 276:
Figure 3: Mass spectrum fitting wit
- Page 277 and 278:
MEASUREMENT OF THE J/ψ INCLUSIVE P
- Page 279 and 280:
2 Counts per 40 MeV/c 120 100 80 60
- Page 281 and 282:
STUDY OF Ke4 DECAYS IN THE NA48/2 E
- Page 283 and 284:
photons were accepted while particl
- Page 285:
6. Structure Functions Diffraction
- Page 288 and 289:
2 Hadronic Final States and Diffrac
- Page 290 and 291:
3 Summary A brief overview of recen
- Page 293 and 294:
Using HERA Data to Determine the In
- Page 295 and 296:
k f n 0.4 0.2 0 -0.2 0.4 0.2 0 -0.2
- Page 297:
The singular term, on the other han
- Page 301 and 302:
Pomeron Kernel: The leading order B
- Page 303 and 304:
DIFFRACTION, SATURATION AND pp CROS
- Page 305 and 306:
In Ref. 6 , the saturated Froissart
- Page 307 and 308:
Transverse Energy Flow with Forward
- Page 309 and 310:
1/N d dE t /dη 0.1 0.09 0.08 0.07
- Page 311:
7. Heavy Ions
- Page 314 and 315:
dη)/(0.5〈 N 〉 ) part ch (dN 10
- Page 316 and 317:
) 3 (fm long R side R out R 400 350
- Page 318 and 319:
correlation density is computed as
- Page 320 and 321:
Away-side gaussian width 1.4 1.2 1
- Page 322 and 323:
Figure 1: (a) J/ψ rapidity distrib
- Page 324 and 325:
lower x, or forward rapidity one ex
- Page 326 and 327:
φ ∆ /d assoc dN trig 1/N 0.5 0.4
- Page 328 and 329:
AA,Pythia I 2.5 2.0 1.5 1.0 0.5 0.0
- Page 330 and 331:
(1/N ) dN/dA evt J φ Δ ) dN/d (1/
- Page 332 and 333:
[GeV] Tower ET Σ 50 45 40 35 30 25
- Page 334 and 335:
3 Results 3.1 Dijet Properties in p
- Page 336 and 337:
(GeV/c) < p > (GeV/c) T T p < 40 20
- Page 338 and 339:
wheredσm(N +N → h+X)/dp Tdy isth
- Page 340 and 341:
R AA 0.6 0.5 0.4 0.3 0.2 0.1 0 0.5
- Page 342 and 343:
Here D is the diffusion coefficient
- Page 345 and 346:
The effect of triangular flow in je
- Page 347 and 348:
When both trigger and associated pa
- Page 349 and 350:
The first Z boson measurement in th
- Page 351 and 352:
Figure 1: Dimuon invariant mass spe
- Page 353:
2. V. Kartvelishvili, R. Kvatadze a
- Page 356 and 357:
esolution [ µ m] ! r 0 d 300 250 2
- Page 358 and 359:
Figure 5: Differential transverse m
- Page 360 and 361:
Figure 1: Average nuclear modificat
- Page 362 and 363:
Another way of using direct photons
- Page 364 and 365:
Pb R g 2 Nuclear Modifications for
- Page 366 and 367:
q T 1/R AA 1.6 1.4 1.2 1 0.8 LO Fra
- Page 368 and 369:
] 2 > [g/cm max
- Page 370 and 371:
Methods (a) and (c) constrain the e
- Page 373 and 374:
EXPERIMENTAL SUMMARY: ENTERING THE
- Page 375 and 376:
ut also for valence quarks involved
- Page 377 and 378:
The sensitivity to Standard Model H
- Page 379 and 380:
Figure 10: Top pair mass spectrum m
- Page 381 and 382:
Figure 13: Particle densities (left
- Page 383 and 384:
4 Low energy precision Spectroscopy
- Page 385:
asymmetries associated to Bd and Bs
- Page 389 and 390:
XLVIth Rencontres de Moriond QCD an


![List of participants 27/2/09 [pdf] - Rencontres de Moriond - IN2P3](https://img.yumpu.com/17975746/1/190x135/list-of-participants-27-2-09-pdf-rencontres-de-moriond-in2p3.jpg?quality=85)