2011 QCD and High Energy Interactions - Rencontres de Moriond ...
2011 QCD and High Energy Interactions - Rencontres de Moriond ...
2011 QCD and High Energy Interactions - Rencontres de Moriond ...

Create successful ePaper yourself
Turn your PDF publications into a flip-book with our unique Google optimized e-Paper software.
e M(Dπ) distributions obtained<br />
D + or D 0 c<strong>and</strong>idate mass si<strong>de</strong>-<br />
mass spectra are presented in<br />
eatures.<br />
r D ∗ 2 (2460)0 <strong>and</strong> D ∗ 2 (2460)+ .<br />
ucted mass to about 3 MeV/c 2 .<br />
on due to fake D + <strong>and</strong> D0 can-<br />
M(Dπ) distributions obtained<br />
D + or D0 ectrum shows a peaking backat<br />
about 2.3 GeV/c<br />
c<strong>and</strong>idate mass si<strong>de</strong>mass<br />
spectra are presented in<br />
atures.<br />
2 due to <strong>de</strong>-<br />
20) 0 <strong>and</strong> D∗ 2 (2460)0 to D∗+ π− .<br />
ents <strong>de</strong>cays to D + π0 <strong>and</strong> the π0 onstruction. The missing π0 has<br />
because the D∗+ <strong>de</strong>cay is very<br />
Therefore, these <strong>de</strong>cays have a<br />
only 5.8 MeV/c 2 <strong>and</strong> a bias of<br />
imilarly, D0π + shows peaking<br />
the <strong>de</strong>cays of the D1(2420) +<br />
r D∗ 2 (2460)0 <strong>and</strong> D∗ 2 (2460)+ ∗0 + ∗0 π where the D <strong>de</strong>cays. to<br />
Events / (0.005 G<br />
2<br />
Events / (0.005 GeV/c 2<br />
Events / (0.005 GeV/c )<br />
2<br />
Events / (0.005 GeV/c )<br />
3<br />
20<br />
2<br />
1<br />
15<br />
0<br />
2.4 2.5 2.6 2.7 2.8<br />
10<br />
5<br />
5<br />
! 1000<br />
! 1000<br />
25<br />
4<br />
Fit AB<br />
25<br />
2 3<br />
20<br />
20<br />
2<br />
D<br />
1<br />
15<br />
1<br />
15<br />
0<br />
10<br />
2.4 2.5 2.6 2.6 2.7 2.7 2.8<br />
2.8<br />
10<br />
∗ D<br />
(2760)<br />
∗ didates by subtracting the M(Dπ) distributions obtained<br />
by selecting events in the D<br />
x1000<br />
Peaking bkg<br />
(2600)<br />
+ or D0 c<strong>and</strong>idate mass si<strong>de</strong>b<strong>and</strong>s.<br />
The D + π− <strong>and</strong> D0π + mass spectra are presented in<br />
Fig. 2 <strong>and</strong> show similar features.<br />
• Prominent peaks for D∗ 2 (2460)0 <strong>and</strong> D∗ 2 (2460)+ .<br />
• The D + π− mass spectrum shows a peaking background<br />
(feeddown) at about 2.3 GeV/c 2 due to <strong>de</strong>cays<br />
from the D1(2420) 0 <strong>and</strong> D∗ 2 (2460)0 to D∗+ π− .<br />
The D∗+ in these events <strong>de</strong>cays to D + π0 <strong>and</strong> the π0 is missing in the reconstruction. The missing π0 has<br />
very low momentum because the D∗+ <strong>de</strong>cay is very<br />
close to threshold. Therefore, these <strong>de</strong>cays have a<br />
mass resolution of only 5.8 MeV/c 2 <strong>and</strong> a bias of<br />
−143.2 MeV/c2 . Similarly, D0π + shows peaking<br />
backgrounds due to the <strong>de</strong>cays of the D1(2420) +<br />
<strong>and</strong> D ∗ 2 (2460)+ to D ∗0 π + where the D ∗0 <strong>de</strong>cays to<br />
D 0 π 0 .<br />
Events / (0.005 GeV<br />
2<br />
Events / (0.005 GeV/c )<br />
25<br />
20<br />
15<br />
10<br />
5<br />
x1000<br />
25<br />
Fit B<br />
20<br />
15<br />
10<br />
5<br />
Peaking bkg<br />
3<br />
2<br />
1<br />
0<br />
2.4 2.5 2.6 2.7 2.8<br />
2<br />
1<br />
D ∗ (2600)<br />
D ∗ (2760)<br />
0<br />
2.4 2.5 2.6 2.7 2.8<br />
Events / ( 0.005 GeV/<br />
)<br />
2<br />
Events / ( 0.005 GeV/c<br />
16<br />
14<br />
12<br />
10<br />
8<br />
6<br />
4<br />
4<br />
3<br />
2<br />
1<br />
0<br />
2.4 2.5 2.6 2.7 2.8<br />
2<br />
2.2<br />
45 Fit E<br />
2.4<br />
! 10<br />
2.6<br />
10<br />
2.8 3 3.2<br />
40<br />
8<br />
35<br />
6<br />
D<br />
30<br />
25<br />
4<br />
2<br />
∗ (2600) 0<br />
D(2550) 0<br />
D(2750) 0<br />
x1000<br />
20<br />
15<br />
10<br />
D ∗ 2(2460) 0<br />
0<br />
2.4 2.5 2.6 2.7 2.8<br />
• Two additional enhanc<br />
<strong>and</strong> ∼2.75 GeV/c 2 , whi<br />
D ∗ (2600) 0 <strong>and</strong> D(2750) 0<br />
Studies of the generic MC simu<br />
the D ∗+ si<strong>de</strong>b<strong>and</strong>s <strong>and</strong> the wr<br />
show no peaking backgrounds<br />
We fit M(D ∗+ π − ) by para<br />
with the function in Eq. (1<br />
D ∗ 2(2460) 0 resonances are mod<br />
functions with appropriate Bla<br />
The D ∗ (2600) 0 <strong>and</strong> D(2750) 0<br />
tic BW functions. The broa<br />
known to <strong>de</strong>cay to this final st<br />
sensitive to it due to its large w<br />
because the background param<br />
Due to the vector nature o<br />
nal state contains additional in<br />
parity (J P )quantumnumbers<br />
rest frame of the D ∗+ ,we<strong>de</strong>fi<br />
the angle between the primary<br />
π + from the D ∗+ <strong>de</strong>cay. The d<br />
ectrum shows a peaking backat<br />
about 2.3 GeV/c 2 due to <strong>de</strong>-<br />
20) 0 <strong>and</strong> D∗ 2 (2460)0 to D∗+ π− .<br />
ents <strong>de</strong>cays to D + π0 <strong>and</strong> the π0 nstruction. The missing π0 has<br />
because the D∗+ <strong>de</strong>cay is very<br />
Therefore, these <strong>de</strong>cays have a<br />
only 5.8 MeV/c 2 <strong>and</strong> a bias of<br />
imilarly, D0π + shows peaking<br />
the <strong>de</strong>cays of the D1(2420) +<br />
∗0 + ∗0 π where the D <strong>de</strong>cays to<br />
0 + π mass distributions show<br />
nd 2.6 <strong>and</strong> 2.75 GeV/c 2 . We<br />
ents D∗ (2600) <strong>and</strong> D∗ (2760).<br />
se mass spectra with those ob-<br />
− → ¯cc Monte Carlo (MC)<br />
e generated using JETSET [9]<br />
e resonances incorporated. The<br />
cted using a <strong>de</strong>tailed GEANT4<br />
<strong>and</strong> the event selection procen<br />
addition, we study Dπ mass<br />
D0 c<strong>and</strong>idate mass si<strong>de</strong>b<strong>and</strong>s,<br />
r wrong-sign D + π + <strong>and</strong> D0π− grounds or reflections that can<br />
<strong>and</strong> 2.76 GeV/c 2 .Inthestudy<br />
we find a peaking background<br />
0 0 c<strong>and</strong>idate is not a true D ,<br />
the primary π + c<strong>and</strong>idate are<br />
+ <strong>de</strong>cay. These combinations<br />
M(D0 π + ) both in the D0 can<strong>and</strong><br />
si<strong>de</strong>b<strong>and</strong>s. However, this<br />
function of the D0 c<strong>and</strong>idate<br />
i<strong>de</strong>b<strong>and</strong> subtraction.<br />
d is mo<strong>de</strong>led using the function:<br />
+c2x 2<br />
for x ≤ x0,<br />
d1x+d2x 2<br />
(1)<br />
for x>x0,<br />
mD + mπ) 2 ][x2 − (mD − mπ) 2 5<br />
25<br />
Fit B<br />
2<br />
20<br />
1<br />
15<br />
0<br />
10<br />
2.4 2.5 2.6 2.7 2.8<br />
5<br />
0<br />
2.2 2.4 2.6 2.8 3 3.2<br />
2<br />
M(D " ) (GeV/c )<br />
FIG. 2: (color online) Mass distribution for D<br />
]<br />
e factor <strong>and</strong> x = M(Dπ). Only<br />
in the piece-wise exponential:<br />
rametersd0<strong>and</strong> d1 are fixed by<br />
ontinuous <strong>and</strong> differentiable at<br />
eaccountforthefeeddownof<br />
convolving Breit-Wigner (BW)<br />
ction <strong>de</strong>scribing the resolution<br />
+ π − (top) <strong>and</strong><br />
D 0 π + (bottom) c<strong>and</strong>idates. Points correspond to data, with<br />
the total fit overlaid as a solid curve. The dotted curves are<br />
the signal components. The lower solid curves correspond<br />
to the smooth combinatoric background <strong>and</strong> to the peaking<br />
backgrounds at 2.3 GeV/c 2 . The inset plots show the distributions<br />
after subtraction of the combinatoric background.<br />
<strong>and</strong> bias obtained from the simulation of these <strong>de</strong>cays.<br />
The mass <strong>and</strong> width of the D1(2420) feeddown are fixed<br />
to the values obtained in the D∗+ π− analysis <strong>de</strong>scribed<br />
below, while the parameters of the D∗ 2 (2460) feeddown<br />
are fixed to those of the true D∗ 2(2460) in the same<br />
M(Dπ) distribution.<br />
The D∗ 2 (2460) is mo<strong>de</strong>led using a relativistic BW function<br />
with the appropriate Blatt-Weisskopf centrifugal<br />
barrier factor [2]. The D∗ (2600) <strong>and</strong> D∗ (2760) are mo<strong>de</strong>led<br />
with relativistic BW functions [2]. Finally, although<br />
not visible in the M(D + π− ) mass distribution, we inclu<strong>de</strong><br />
a BW function to account for the known resonance<br />
D∗ 0(2400), which is expected to <strong>de</strong>cay to this final state.<br />
The χ2 per number of <strong>de</strong>grees of freedom (NDF) of the fit<br />
<strong>de</strong>creases from 596/245 to 281/242 when this resonance<br />
is inclu<strong>de</strong>d. This resonance is very broad <strong>and</strong> is present<br />
together with the feeddown <strong>and</strong> D∗ 2(2460) 0 0 + π mass distributions show<br />
und 2.6 <strong>and</strong> 2.75 GeV/c<br />
;thereforewe<br />
restrict its mass <strong>and</strong> width parameters to be within 2σ<br />
of the known values [5]. The shapes of the signal components<br />
are corrected for a small variation of the efficiency<br />
as a function of M(Dπ) <strong>and</strong> are multiplied by the twobody<br />
phase-space factor. They are also corrected for the<br />
mass resolution by convolving them with the resolution<br />
function <strong>de</strong>termined from MC simulation of signal <strong>de</strong>-<br />
2 . We<br />
ents D∗ (2600) <strong>and</strong> D∗ (2760).<br />
se mass spectra with those ob-<br />
− → ¯cc Monte Carlo (MC)<br />
e generated using JETSET [9]<br />
le resonances incorporated. The<br />
cted using a <strong>de</strong>tailed GEANT4<br />
<strong>and</strong> the event selection procen<br />
addition, we study Dπ mass<br />
D0 c<strong>and</strong>idate mass si<strong>de</strong>b<strong>and</strong>s,<br />
r wrong-sign D + π + <strong>and</strong> D0π− grounds or reflections that can<br />
6 <strong>and</strong> 2.76 GeV/c 2 .Inthestudy<br />
we find a peaking background<br />
D0 c<strong>and</strong>idate is not a true D0 ,<br />
d the primary π + c<strong>and</strong>idate are<br />
+ <strong>de</strong>cay. These combinations<br />
M(D0 π + ) both in the D0 can<strong>and</strong><br />
si<strong>de</strong>b<strong>and</strong>s. However, this<br />
function of the D0 c<strong>and</strong>idate<br />
si<strong>de</strong>b<strong>and</strong> subtraction.<br />
d is mo<strong>de</strong>led using the function:<br />
+c2x 2<br />
for x ≤ x0,<br />
d1x+d2x 2<br />
(1)<br />
for x>x0,<br />
(mD + mπ) 2 ][x2 − (mD − mπ) 2 5<br />
0<br />
2.2 2.4 2.6 2.8 3 3.2<br />
2<br />
M(D " ) (GeV/c )<br />
FIG. 2: (color online) Mass distribution for D<br />
]<br />
e factor <strong>and</strong> x = M(Dπ). Only<br />
in the piece-wise exponential:<br />
rametersd0<strong>and</strong> d1 are fixed by<br />
ontinuous <strong>and</strong> differentiable at<br />
eaccountforthefeeddownof<br />
convolving Breit-Wigner (BW)<br />
ction <strong>de</strong>scribing the resolution<br />
+ π − (top) <strong>and</strong><br />
D 0 π + (bottom) c<strong>and</strong>idates. Points correspond to data, with<br />
the total fit overlaid as a solid curve. The dotted curves are<br />
the signal components. The lower solid curves correspond<br />
to the smooth combinatoric background <strong>and</strong> to the peaking<br />
backgrounds at 2.3 GeV/c 2 . The inset plots show the distributions<br />
after subtraction of the combinatoric background.<br />
<strong>and</strong> bias obtained from the simulation of these <strong>de</strong>cays.<br />
The mass <strong>and</strong> width of the D1(2420) feeddown are fixed<br />
to the values obtained in the D∗+ π− analysis <strong>de</strong>scribed<br />
below, while the parameters of the D∗ 2 (2460) feeddown<br />
are fixed to those of the true D∗ 2(2460) in the same<br />
M(Dπ) distribution.<br />
The D∗ 2 (2460) is mo<strong>de</strong>led using a relativistic BW function<br />
with the appropriate Blatt-Weisskopf centrifugal<br />
barrier factor [2]. The D∗ (2600) <strong>and</strong> D∗ (2760) are mo<strong>de</strong>led<br />
with relativistic BW functions [2]. Finally, although<br />
not visible in the M(D + π− ) mass distribution, we inclu<strong>de</strong><br />
a BW function to account for the known resonance<br />
D∗ 0(2400), which is expected to <strong>de</strong>cay to this final state.<br />
The χ2 per number of <strong>de</strong>grees of freedom (NDF) of the fit<br />
<strong>de</strong>creases from 596/245 to 281/242 when this resonance<br />
is inclu<strong>de</strong>d. This resonance is very broad <strong>and</strong> is present<br />
together with the feeddown <strong>and</strong> D∗ 2(2460) 0 M(D<br />
;thereforewe<br />
restrict its mass <strong>and</strong> width parameters to be within 2σ<br />
of the known values [5]. The shapes of the signal components<br />
are corrected for a small variation of the efficiency<br />
as a function of M(Dπ) <strong>and</strong> are multiplied by the twobody<br />
phase-space factor. They are also corrected for the<br />
mass resolution by convolving them with the resolution<br />
function <strong>de</strong>termined from MC simulation of signal <strong>de</strong>-<br />
+ π − )=m(K − π + π + π − ) − m(K − π + π + 0<br />
)+mD +<br />
Resonance Mass (MeV) Signif.<br />
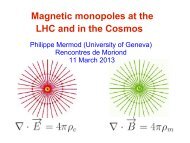
D∗ (2600) 0 2608.7 ± 2.4 ± 2.5 3.9σ<br />
D∗ (2760) 0 2763.3 ± 2.3 ± 2.3 8.9σ<br />
(a) D + π − • Both D<br />
system<br />
+ π− <strong>and</strong> D0π + mass distributions show<br />
new structures around 2.6 <strong>and</strong> 2.75 GeV/c 2 . We<br />
call these enhancements D∗ (2600) <strong>and</strong> D∗ (2760).<br />
We have compared these mass spectra with those obtained<br />
from generic e + e− → ¯cc Monte Carlo (MC)<br />
events. These events were generated using JETSET [9]<br />
with all the known particle resonances incorporated. The<br />
events are then reconstructed using a <strong>de</strong>tailed GEANT4<br />
[10] <strong>de</strong>tector simulation <strong>and</strong> the event selection procedure<br />
used for the data. In addition, we study Dπ mass<br />
spectra from the D + <strong>and</strong> D0 c<strong>and</strong>idate mass si<strong>de</strong>b<strong>and</strong>s,<br />
as well as mass spectra for wrong-sign D + π + <strong>and</strong> D0π− samples. We find no backgrounds or reflections that can<br />
cause the structures at 2.6 <strong>and</strong> 2.76 GeV/c 2 .Inthestudy<br />
of the D0π + final state we find a peaking background<br />
due to events where the D0 c<strong>and</strong>idate is not a true D0 ,<br />
but the K− c<strong>and</strong>idate <strong>and</strong> the primary π + c<strong>and</strong>idate are<br />
from a true D0 → K−π + <strong>de</strong>cay. These combinations<br />
produce enhancements in M(D0 π + ) both in the D0 c<strong>and</strong>idate<br />
mass signal region <strong>and</strong> si<strong>de</strong>b<strong>and</strong>s. However, this<br />
background is linear as a function of the D0 c<strong>and</strong>idate<br />
mass, is removed by the si<strong>de</strong>b<strong>and</strong> subtraction.<br />
The smooth background is mo<strong>de</strong>led using the function:<br />
<br />
e<br />
B(x) =P (x) ×<br />
c1x+c2x2 for x ≤ x0,<br />
ed0+d1x+d2x2 (1)<br />
for x>x0,<br />
where P (x) ≡ 1<br />
0<br />
2.2 2.4 2.6 2.8 3 3.2<br />
2<br />
M(D " ) (GeV/c )<br />
FIG. 2: (color online) Mass distribution for D<br />
<br />
2x [x2 − (mD + mπ) 2 ][x2 − (mD − mπ) 2 ]<br />
is a two-body phase-space factor <strong>and</strong> x = M(Dπ). Only<br />
four parameters are free in the piece-wise exponential:<br />
c1, c2, d2, <strong>and</strong> x0. Theparametersd0<strong>and</strong> d1 are fixed by<br />
requiring that B(x) be continuous <strong>and</strong> differentiable at<br />
the transition point x0. Weaccountforthefeeddownof<br />
peaking backgrounds by convolving Breit-Wigner (BW)<br />
functions [11] with a function <strong>de</strong>scribing the resolution<br />
+ π − (top) <strong>and</strong><br />
D 0 π + (bottom) c<strong>and</strong>idates. Points correspond to data, with<br />
the total fit overlaid as a solid curve. The dotted curves are<br />
the signal components. The lower solid curves correspond<br />
to the smooth combinatoric background <strong>and</strong> to the peaking<br />
backgrounds at 2.3 GeV/c 2 . The inset plots show the distributions<br />
after subtraction of the combinatoric background.<br />
<strong>and</strong> bias obtained from the simulation of these <strong>de</strong>cays.<br />
The mass <strong>and</strong> width of the D1(2420) feeddown are fixed<br />
to the values obtained in the D∗+ π− analysis <strong>de</strong>scribed<br />
below, while the parameters of the D∗ 2 (2460) feeddown<br />
are fixed to those of the true D∗ 2(2460) in the same<br />
M(Dπ) distribution.<br />
The D∗ 2 (2460) is mo<strong>de</strong>led using a relativistic BW function<br />
with the appropriate Blatt-Weisskopf centrifugal<br />
barrier factor [2]. The D∗ (2600) <strong>and</strong> D∗ (2760) are mo<strong>de</strong>led<br />
with relativistic BW functions [2]. Finally, although<br />
not visible in the M(D + π− ) mass distribution, we inclu<strong>de</strong><br />
a BW function to account for the known resonance<br />
D∗ 0(2400), which is expected to <strong>de</strong>cay to this final state.<br />
The χ2 per number of <strong>de</strong>grees of freedom (NDF) of the fit<br />
<strong>de</strong>creases from 596/245 to 281/242 when this resonance<br />
is inclu<strong>de</strong>d. This resonance is very broad <strong>and</strong> is present<br />
together with the feeddown <strong>and</strong> D∗ 2(2460) 0 M(D<br />
;thereforewe<br />
restrict its mass <strong>and</strong> width parameters to be within 2σ<br />
of the known values [5]. The shapes of the signal components<br />
are corrected for a small variation of the efficiency<br />
as a function of M(Dπ) <strong>and</strong> are multiplied by the twobody<br />
phase-space factor. They are also corrected for the<br />
mass resolution by convolving them with the resolution<br />
function <strong>de</strong>termined from MC simulation of signal <strong>de</strong>-<br />
0π + )=m(K−π + π + ) − m(K−π + )+mD0 Resonance Mass (MeV) Signif.<br />
D∗ (2600) + 2621.3 ± 3.7 ± 4.2 2.8σ<br />
D∗ (2760) + 2769.7 ± 3.8 ± 1.5 3.5σ<br />
(b) D 0 π + 5<br />
2.2 2.4 2.6 2.8 3 3.2<br />
*+ -<br />
2<br />
M(D " ) (GeV/c )<br />
FIG. 3: (color online) Mass distributions for D<br />
system<br />
∗+ π − c<strong>and</strong>idates.<br />
Top: c<strong>and</strong>idates with | cos θH| > 0.75. Middle: c<strong>and</strong>idates<br />
with | cos θH| < 0.5. Bottom: all c<strong>and</strong>idates. Points<br />
correspond to data, with the total fit overlaid as a solid curve.<br />
The lower solid curve is the combinatoric background, <strong>and</strong><br />
the dotted curves are the signal components. The inset plots<br />
show the distributions after subtraction of the combinatoric<br />
background.<br />
cays. The fit to the M(D + π− ) distribution (Fit A) is<br />
shown in Fig. 2 (top). The results of this fit, as well as<br />
fits to the other final states <strong>de</strong>scribed below, are shown<br />
in Table I. In this table, the significance for each new<br />
signal is <strong>de</strong>fined as the signal yield divi<strong>de</strong>d by its total<br />
uncertainty.<br />
The fit to the D0π + mass spectrum is similar to that<br />
<strong>de</strong>scribed for the D + π− system. Because the feeddown<br />
is larger <strong>and</strong> the statistical precision of the resonances is<br />
not as good as for D + π− , we fix the width parameters<br />
of all resonances to the values <strong>de</strong>termined from D + π− the predicted resonances, assu<br />
are given in Table II. Initially<br />
the M(D∗+ π− ) distribution in<br />
signals at ∼2.6 GeV/c 2 <strong>and</strong> at<br />
when we extract the yields as a<br />
that the mean value of the pea<br />
by ∼70 MeV/c2 between cosθ <strong>and</strong> <strong>de</strong>creases again as cos θH<br />
suggests two resonances with d<br />
tributions are present in this m<br />
incorporate a new component<br />
into our mo<strong>de</strong>l at ∼2.55 GeV/<br />
eters of this component by re<br />
or<strong>de</strong>r to suppress the other re<br />
C), shown in Fig. 3 (top), we<br />
D∗ 2(2460) 0 <strong>and</strong> D∗ (2600) 0 to<br />
We obtain a χ2 /NDF of 214/2<br />
<strong>de</strong>termines the parameters of<br />
perform a complementary fit<br />
(middle), in which we require<br />
nate in favor of the D∗ (2600) 0<br />
210/209 for this fit. To <strong>de</strong>term<br />
the D(2750) 0 D1(2420)<br />
signal we fit the<br />
0<br />
M(D ∗+ π − )=m(K − π + (π + π − )π + s π − ) − m(K − π + (π + π − )π + s )+mD∗+ Resonance Mass (MeV) Signif.<br />
D(2550) 0 2539.4 ± 4.5 ± 6.8 3.0σ<br />
D(2750) 0 2752.4 ± 1.7 ± 2.7 4.2σ<br />
(c) D ∗+ π − system<br />
Figure 1: Mass distribution of the reconstructed c<strong>and</strong>idates. Points correspond to data, with the total fit overlaid<br />
as a solid blue curve. The red dashed curves are the signal components. The black solid curve correspond to<br />
the smooth combinatoric background <strong>and</strong> to the peaking backgrounds at 2.3 GeV/c 2 . The inset plots show the<br />
distributions after subtraction of the combinatoric background. In the table, the first error for the mass is statistic,<br />
while the second is the systematic one.<br />
backgrounds are larger in the M(D0π + ) distribution, when fitting that distribution additional<br />
parameters need to be fixed to the values fitted to M(D + π− ) distribution, assuming isospin<br />
symmetry. The parameters <strong>and</strong> the significances for the new structures are shown in the tables<br />
in Fig. 1. The new resonances found in the D0π + system are consistent with being the isospin<br />
partners of the D + π− system resonances.<br />
To search for new states in the D∗+ π− system we <strong>de</strong>fine the variable M(D∗+ π− ) =<br />
m(K−π + (π + π− )π + s π− )−m(K −π + (π + π− )π + s )+m ∗+<br />
D , where m∗+<br />
D is the value of the D∗+ mass 5 .<br />
The M(D∗+ π− ) distribution is shown in Fig. 1(c) <strong>and</strong> shows the following features: prominent<br />
D1(2410) 0 <strong>and</strong> D∗ 2 (2460)0 peaks, <strong>and</strong> two structures at ∼ 2.60 GeV/c2 <strong>and</strong> ∼ 2.75 GeV/c2 . The<br />
fit to this distribution is really similar to the previous ones, but here the final state contains<br />
additional information about the spin-parity quantum number of the resonances. In the rest<br />
frame of the D∗+ , we <strong>de</strong>fine the helicity angle θH as the angle between the pion π− <strong>and</strong> the slow<br />
pion π + from the D∗+ <strong>de</strong>cay. Fitting the M(D∗+ π− ) distribution in a limited range of θH, we<br />
find that another resonance around 2.55 GeV/c2 need to be introduced, in addition to the two<br />
mentioned above. Again some parameters need to be fixed to the values obtained from the fit to<br />
M(D + π− ) distribution. The parameters <strong>and</strong> the significances for the new structures are shown<br />
in Fig. 1(c). The final mo<strong>de</strong>l is then used to extract the signal yields as a function of cos θH for<br />
10 sub-samples. The cos θH distribution parameter for the D1(2420) are consistent with previous<br />
measurements 6 . The D(2550) 0 <strong>and</strong> D∗ (2600) 0 have mass values <strong>and</strong> cos θH distributions<br />
consistent with the predicted radial excitations, respectively, D1 0 (2S) <strong>and</strong> D3 1 (2S).<br />
3 D1(2420) 0 → D 0 γ radiative transistion using BELLE dataset<br />
In this analysis we search for the radiative transition D1(2420) 0 → D 0 γ using a dataset of 656<br />
fb −1 collected at CM energies near 10.58 GeV by the BELLE <strong>de</strong>tector 7 . The st<strong>and</strong>ard ∆E<br />
<strong>and</strong> m bc variables are used to select the B mesons in the B − → π − D1(2420) 0 mo<strong>de</strong>. The<br />
corresponding pionic <strong>de</strong>cays B − → π − D 0 (0,2) → π0 D 0 → K − π + form an important background<br />
to the radiative transition analysis, with the D2 peaking close to the signal region, <strong>and</strong> have<br />
never previously been measured. This background is inclu<strong>de</strong>d in the final fit performed on the<br />
m(D 0 γ) distribution. In the rest frame of the D 0 , we <strong>de</strong>fine the <strong>de</strong>cay angle θJ as the angle<br />
between the γ <strong>and</strong> the pion π + from the D 0 <strong>de</strong>cay. The final fit is performed simultaneously<br />
over 4 separate ranges of cos θJ, as shown in Fig. 2.<br />
The preliminary result we obtain for the branching fraction is: B(B − → π − D1(2420) 0 ) ×<br />
B(D1(2420) 0 → D 0 γ) = 5.0 ± 0.5(stat) ± 1.5(syst). C<strong>and</strong>idates in the cos θJ range [−1.0, 0.7]


![List of participants 27/2/09 [pdf] - Rencontres de Moriond - IN2P3](https://img.yumpu.com/17975746/1/190x135/list-of-participants-27-2-09-pdf-rencontres-de-moriond-in2p3.jpg?quality=85)