- Page 1 and 2:
PTOLEMY II HETEROGENEOUS CONCURRENT
- Page 3 and 4:
VOLUME 1 INTRODUCTION TO PTOLEMY II
- Page 5 and 6: Volume 1 Contents Introduction to P
- Page 7 and 8: 2.10.3. Constructing Modal Models 8
- Page 9 and 10: 7. MoML 191 7.1. Introduction 191 7
- Page 11 and 12: 1 Introduction Author: Edward A. Le
- Page 13 and 14: Introduction heterochronous dataflo
- Page 15 and 16: Introduction A major emphasis in Pt
- Page 17 and 18: Introduction determine when actors
- Page 19 and 20: Introduction provides levels of vis
- Page 21 and 22: Introduction is a guard, and the se
- Page 23 and 24: Introduction well. All of these are
- Page 25 and 26: Introduction clients to update thei
- Page 27 and 28: Introduction will be supplied with
- Page 29 and 30: Introduction 1.3.12 Synchronous Dat
- Page 31 and 32: Introduction FIGURE 1.10. Refinemen
- Page 33 and 34: Introduction occlusions due to terr
- Page 35 and 36: Introduction tion. The overall arch
- Page 37 and 38: Introduction kernel.attributes This
- Page 39 and 40: Introduction 1.5.2 Overview of Key
- Page 41 and 42: Introduction Actor interfaces are k
- Page 43 and 44: Heterogeneous Concurrent Modeling a
- Page 45 and 46: Introduction actor actor.gui data.e
- Page 47 and 48: Introduction cient, scalable, and u
- Page 49 and 50: Introduction 1.5.8 Future Capabilit
- Page 51 and 52: Introduction Appendix A: UML — Un
- Page 53 and 54: Introduction grams, the only constr
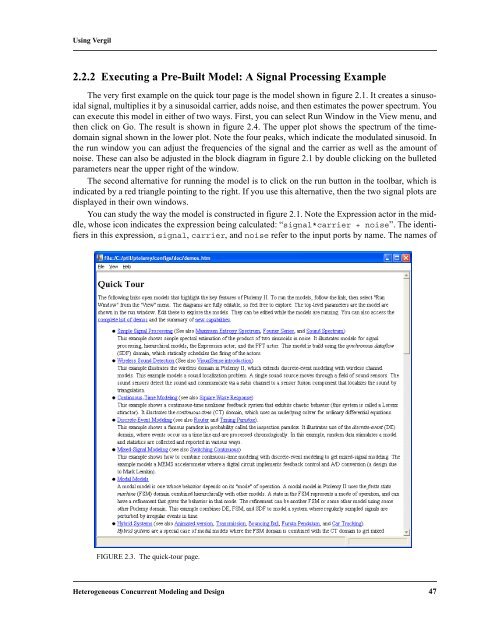
- Page 55: 2 Using Vergil Authors: Edward A. L
- Page 59 and 60: Using Vergil The Lorenz attractor m
- Page 61 and 62: Using Vergil The Continuous-Time (C
- Page 63 and 64: Using Vergil box in figure 2.11. En
- Page 65 and 66: Using Vergil Don’t panic! Excepti
- Page 67 and 68: Using Vergil tions are a normal par
- Page 69 and 70: Using Vergil 2.4 Hierarchy Ptolemy
- Page 71 and 72: Using Vergil Then using these ports
- Page 73 and 74: Using Vergil the default 0.1 to 0.0
- Page 75 and 76: Using Vergil pan window, it is easy
- Page 77 and 78: Using Vergil FIGURE 2.33. The pan w
- Page 79 and 80: Using Vergil we have modified the c
- Page 81 and 82: Using Vergil model, simply copy (or
- Page 83 and 84: Using Vergil A key issue is to deci
- Page 85 and 86: Using Vergil instances. This proble
- Page 87 and 88: Using Vergil quick tour for more de
- Page 89 and 90: Using Vergil uses the index in the
- Page 91 and 92: Using Vergil AddSubtract actor, and
- Page 93 and 94: Using Vergil If you look inside the
- Page 95 and 96: Using Vergil If you look inside the
- Page 97 and 98: Using Vergil transition (or right c
- Page 99 and 100: Using Vergil Once you have created
- Page 101 and 102: Using Vergil The grid is turned off
- Page 103 and 104: Authors: Edward A. Lee Xiaojun Liu
- Page 105 and 106: Expressions classes to create a gen
- Page 107 and 108:
Expressions The % operation is a mo
- Page 109 and 110:
Expressions attribute, which includ
- Page 111 and 112:
Expressions 3.3.5 State Machines Ex
- Page 113 and 114:
Expressions whose value is an array
- Page 115 and 116:
Expressions from it. For instance,
- Page 117 and 118:
Expressions defined. For example, >
- Page 119 and 120:
Expressions length is given by the
- Page 121 and 122:
Expressions Thus, for example, you
- Page 123 and 124:
Expressions number. With one additi
- Page 125 and 126:
Expressions value. For example, fix
- Page 127 and 128:
Expressions In the example in figur
- Page 129 and 130:
Expressions A.2 Basic Mathematical
- Page 131 and 132:
Expressions A.3 Matrix, Array, and
- Page 133 and 134:
Expressions A.5 Signal Processing F
- Page 135 and 136:
Expressions TABLE 8: Functions perf
- Page 137 and 138:
4 Actor Libraries Authors: Elaine C
- Page 139 and 140:
Actor Libraries properly in the CT
- Page 141 and 142:
Actor Libraries ing that multiple c
- Page 143 and 144:
Actor Libraries TypedAtomicActor «
- Page 145 and 146:
Actor Libraries SequenceScope (exte
- Page 147 and 148:
Actor Libraries UnsignedByteArrayTo
- Page 149 and 150:
Actor Libraries MobileFunction (ext
- Page 151 and 152:
Actor Libraries LogicFunction (exte
- Page 153 and 154:
Actor Libraries Sleep (extends Tran
- Page 155 and 156:
Actor Libraries VariableFIR (extend
- Page 157 and 158:
Actor Libraries Integrator: Integra
- Page 159 and 160:
Actor Libraries Figure 4.4 shows th
- Page 161 and 162:
5 Designing Actors Authors: Christo
- Page 163 and 164:
Designing Actors /** Javadoc commen
- Page 165 and 166:
Designing Actors although with most
- Page 167 and 168:
Designing Actors import ptolemy.act
- Page 169 and 170:
Designing Actors makes such actors
- Page 171 and 172:
Designing Actors same parameter val
- Page 173 and 174:
Designing Actors morphic actor comp
- Page 175 and 176:
Designing Actors To get data polymo
- Page 177 and 178:
Designing Actors public class Seque
- Page 179 and 180:
Designing Actors be used in domains
- Page 181 and 182:
Designing Actors alComm actor. Beca
- Page 183 and 184:
Designing Actors attribute has valu
- Page 185 and 186:
Designing Actors import ptolemy.act
- Page 187 and 188:
6 Coding Style Authors: Christopher
- Page 189 and 190:
Coding Style /* One line descriptio
- Page 191 and 192:
Coding Style Copyright (c) 2004 The
- Page 193 and 194:
Coding Style @version $Id: NamedObj
- Page 195 and 196:
Coding Style } We use instead the i
- Page 197 and 198:
Coding Style * @exception MyExcepti
- Page 199 and 200:
Coding Style + "it does not impleme
- Page 201 and 202:
Authors: Edward A. Lee Steve Neuend
- Page 203 and 204:
MoML cutes it forever, until you hi
- Page 205 and 206:
MoML A second difference between ou
- Page 207 and 208:
MoML
- Page 209 and 210:
MoML 7.3.3 Names and Classes Most M
- Page 211 and 212:
MoML Here, the element named
- Page 213 and 214:
MoML implement. 7.3.7 Doc Element S
- Page 215 and 216:
MoML It is also sometimes necess
- Page 217 and 218:
MoML then there will be a link t
- Page 219 and 220:
MoML found. For example, if the cla
- Page 221 and 222:
MoML it cannot collide with the nam
- Page 223 and 224:
MoML The rendering of the icon is d
- Page 225 and 226:
MoML 7.4.5 Deleting Entities, Relat
- Page 227 and 228:
MoML This unlinks a port from the s
- Page 229 and 230:
MoML model. The EntityLibrary class
- Page 231 and 232:
MoML Suppose that using incremental
- Page 233 and 234:
MoML Generate a sine wave.
- Page 235 and 236:
MoML
- Page 237 and 238:
MoML Number of iterations in
- Page 239 and 240:
MoML -P- The f
- Page 241 and 242:
MoML -P- The phase,
- Page 243 and 244:
8 Custom Applets Authors: Edward A.
- Page 245 and 246:
Custom Applets html code, see the J
- Page 247 and 248:
Custom Applets public class Tutoria
- Page 249 and 250:
Custom Applets then the result of
- Page 251 and 252:
Custom Applets 8.3.5 Using Model Pa
- Page 253 and 254:
Custom Applets ptolemy/domains/doma
- Page 255 and 256:
References [1] G. Agha, Actors: A M
- Page 257 and 258:
[33] S. A. Edwards, “The Specific
- Page 259 and 260:
[67] E. Kohler, The Click Modular R
- Page 261 and 262:
[95] J. Liu, X. Liu, T. J. Koo, B.
- Page 263 and 264:
[132]W. R. Sutherland, "The on-Line
- Page 265 and 266:
Glossary abstract syntax ..........
- Page 267 and 268:
Ptolemy II ........................
- Page 269 and 270:
Index Symbols - in UML 41 # in UML
- Page 271 and 272:
coin flips 142 Color class 173 colo
- Page 273 and 274:
entity in XML 198 EntityLibrary cla
- Page 275 and 276:
Director class 159 inverse FFT 124
- Page 277 and 278:
CompositeEntity class 206 nextPower
- Page 279 and 280:
safety 34 SampleDelay actor 78, 138
- Page 281 and 282:
type constraint 155 type constraint