The Economic Value of Water and Ecosystem Preservation
The Economic Value of Water and Ecosystem Preservation
The Economic Value of Water and Ecosystem Preservation
You also want an ePaper? Increase the reach of your titles
YUMPU automatically turns print PDFs into web optimized ePapers that Google loves.
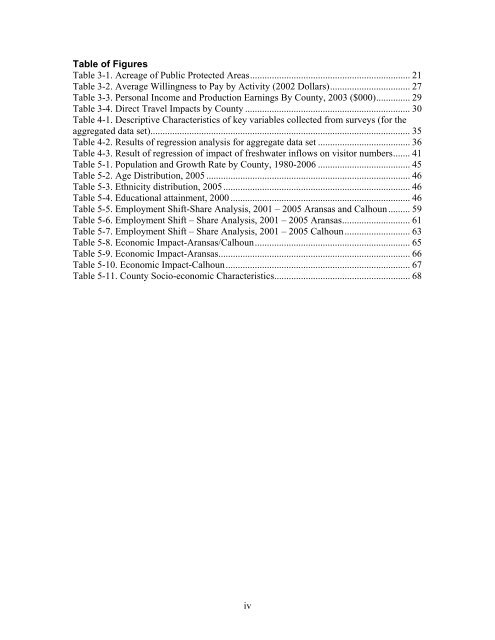
Table <strong>of</strong> Figures<br />
Table 3-1. Acreage <strong>of</strong> Public Protected Areas.................................................................. 21<br />
Table 3-2. Average Willingness to Pay by Activity (2002 Dollars)................................. 27<br />
Table 3-3. Personal Income <strong>and</strong> Production Earnings By County, 2003 ($000).............. 29<br />
Table 3-4. Direct Travel Impacts by County .................................................................... 30<br />
Table 4-1. Descriptive Characteristics <strong>of</strong> key variables collected from surveys (for the<br />
aggregated data set)........................................................................................................... 35<br />
Table 4-2. Results <strong>of</strong> regression analysis for aggregate data set ...................................... 36<br />
Table 4-3. Result <strong>of</strong> regression <strong>of</strong> impact <strong>of</strong> freshwater inflows on visitor numbers....... 41<br />
Table 5-1. Population <strong>and</strong> Growth Rate by County, 1980-2006 ...................................... 45<br />
Table 5-2. Age Distribution, 2005 .................................................................................... 46<br />
Table 5-3. Ethnicity distribution, 2005............................................................................. 46<br />
Table 5-4. Educational attainment, 2000 .......................................................................... 46<br />
Table 5-5. Employment Shift-Share Analysis, 2001 – 2005 Aransas <strong>and</strong> Calhoun......... 59<br />
Table 5-6. Employment Shift – Share Analysis, 2001 – 2005 Aransas............................ 61<br />
Table 5-7. Employment Shift – Share Analysis, 2001 – 2005 Calhoun........................... 63<br />
Table 5-8. <strong>Economic</strong> Impact-Aransas/Calhoun................................................................ 65<br />
Table 5-9. <strong>Economic</strong> Impact-Aransas............................................................................... 66<br />
Table 5-10. <strong>Economic</strong> Impact-Calhoun............................................................................ 67<br />
Table 5-11. County Socio-economic Characteristics........................................................ 68<br />
iv


