

The Economic Value of Water and Ecosystem Preservation
The Economic Value of Water and Ecosystem Preservation
The Economic Value of Water and Ecosystem Preservation

Create successful ePaper yourself
Turn your PDF publications into a flip-book with our unique Google optimized e-Paper software.
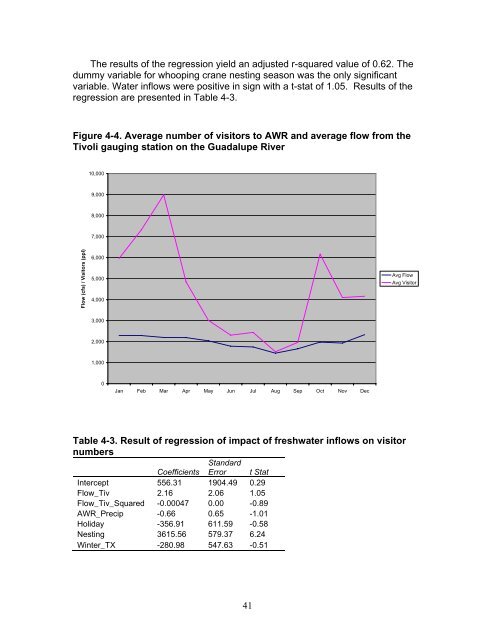
<strong>The</strong> results <strong>of</strong> the regression yield an adjusted r-squared value <strong>of</strong> 0.62. <strong>The</strong><br />
dummy variable for whooping crane nesting season was the only significant<br />
variable. <strong>Water</strong> inflows were positive in sign with a t-stat <strong>of</strong> 1.05. Results <strong>of</strong> the<br />
regression are presented in Table 4-3.<br />
Figure 4-4. Average number <strong>of</strong> visitors to AWR <strong>and</strong> average flow from the<br />
Tivoli gauging station on the Guadalupe River<br />
Flow (cfs) / Visitors (ppl)<br />
10,000<br />
9,000<br />
8,000<br />
7,000<br />
6,000<br />
5,000<br />
4,000<br />
3,000<br />
2,000<br />
1,000<br />
0<br />
Jan Feb Mar Apr May Jun Jul Aug Sep Oct Nov Dec<br />
Table 4-3. Result <strong>of</strong> regression <strong>of</strong> impact <strong>of</strong> freshwater inflows on visitor<br />
numbers<br />
St<strong>and</strong>ard<br />
Coefficients Error t Stat<br />
Intercept 556.31 1904.49 0.29<br />
Flow_Tiv 2.16 2.06 1.05<br />
Flow_Tiv_Squared -0.00047 0.00 -0.89<br />
AWR_Precip -0.66 0.65 -1.01<br />
Holiday -356.91 611.59 -0.58<br />
Nesting 3615.56 579.37 6.24<br />
Winter_TX -280.98 547.63 -0.51<br />
41<br />
Avg Flow<br />
Avg Visitor


