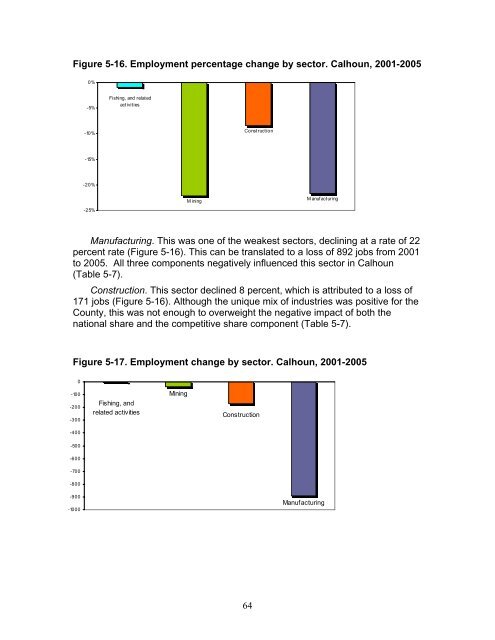
Figure 5-16. Employment percentage change by sector. Calhoun, 2001-2005 0% -5% -10% -15% -20% -25% Fishing, <strong>and</strong> related activit ies M ining Const ruct ion 64 M anuf acturing Manufacturing. This was one <strong>of</strong> the weakest sectors, declining at a rate <strong>of</strong> 22 percent rate (Figure 5-16). This can be translated to a loss <strong>of</strong> 892 jobs from 2001 to 2005. All three components negatively influenced this sector in Calhoun (Table 5-7). Construction. This sector declined 8 percent, which is attributed to a loss <strong>of</strong> 171 jobs (Figure 5-16). Although the unique mix <strong>of</strong> industries was positive for the County, this was not enough to overweight the negative impact <strong>of</strong> both the national share <strong>and</strong> the competitive share component (Table 5-7). Figure 5-17. Employment change by sector. Calhoun, 2001-2005 0 -100 -200 -300 -400 -500 -600 -700 -800 -900 -1000 Mining Fishing, <strong>and</strong> related activities Construction Manufacturing
5.3.2. Input-Output Analysis <strong>The</strong> input-output modeling via IMPLAN is based on the county level. We had the opportunity to develop an input-output model that consisted <strong>of</strong> as many counties as we chose. To provide a more regional approach we analyze the economic impact <strong>of</strong> employment change in the four sectors starting with the combined Aransas/Calhoun region, <strong>and</strong> then Aransas <strong>and</strong> Calhoun separately. Once again, Refugio has no measurable fishing industry to speak <strong>of</strong> so it is not included in the analysis. Aransas/Calhoun <strong>The</strong> two county region <strong>of</strong> Aransas <strong>and</strong> Calhoun tells a much different story then the counties analyzed separately. Fishing employment has decreased over the time period analyzed, as identified in the previous section, for both counties. <strong>The</strong> combined impact has been a loss <strong>of</strong> $3.3 million in output, 93 jobs, <strong>and</strong> $1.7 million in income (see Table 5-8). Mining (oil <strong>and</strong> gas) has bolstered the regions economic activity. This is no doubt heavily influenced by high oil <strong>and</strong> natural gas prices which have created the needed incentive to increase output <strong>of</strong> currently producing wells, <strong>and</strong> bring into production new <strong>and</strong> old wells that would otherwise have been considered economically infeasible. As a result, output, employment, <strong>and</strong> income have all increased for this sector on a two county regional level. Construction output, employment, <strong>and</strong> income grew during this time period as this region was buoyed by a number <strong>of</strong> events. Nationally housing starts were on the rise as financing for purchases were relatively easy to acquire. However, we are currently seeing the results <strong>of</strong> that superheated housing market. Secondly, the region experienced an increase in Winter Texans <strong>and</strong> permanent retirees, which pushed up dem<strong>and</strong> for housing. As will be shown below, this impact was more pronounced in Aransas County. Table 5-8. <strong>Economic</strong> Impact-Aransas/Calhoun Direct Indirect Induced Total Fishing (-) Output $2,481,680 $345,099 $512,675 $3,339,454 Employment 83 3.5 6.4 92.9 Income $1,358,962 $139,571 $150,679 $1,649,212 Mining (+) Output $22,181,952 $3,654.621 $1,558,958 $27,395,531 Employment 53 20.5 19.6 93.1 Income $3,851,896 $958,312 $458,294 $5,268,501 Manufacturing (-) Output $588,387,648 $100,257,774 $60,438,499 $749,083,942 Employment 875 522.2 758 2,155.8 Income $147,530,896 $26,629,179 $17,762,324 $191,922,404 Construction (+) Output $5,015,053 $730,655 $531,382 $6,277,090 Employment 32 10.2 6.7 48.9 Income $1,300,606 $315,171 $156,203 $1,771,980 65