

The Economic Value of Water and Ecosystem Preservation
The Economic Value of Water and Ecosystem Preservation
The Economic Value of Water and Ecosystem Preservation

Create successful ePaper yourself
Turn your PDF publications into a flip-book with our unique Google optimized e-Paper software.
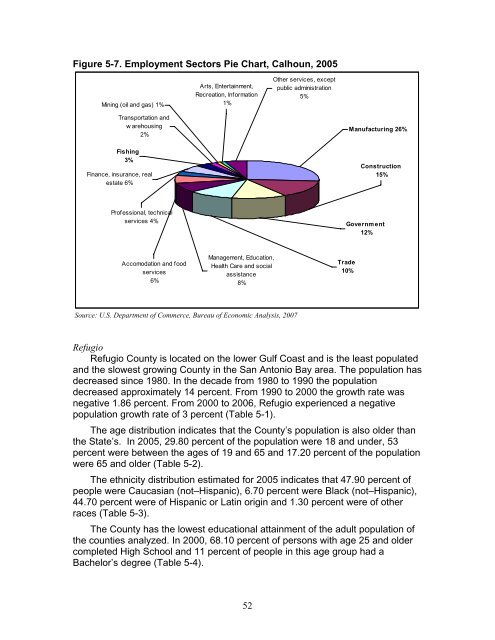
Figure 5-7. Employment Sectors Pie Chart, Calhoun, 2005<br />
Mining (oil <strong>and</strong> gas) 1%<br />
Transportation <strong>and</strong><br />
w arehousing<br />
2%<br />
Fishing<br />
3%<br />
Finance, insurance, real<br />
estate 6%<br />
Pr<strong>of</strong>essional, technical<br />
services 4%<br />
Accomodation <strong>and</strong> food<br />
services<br />
6%<br />
Arts, Entertainment,<br />
Recreation, Information<br />
1%<br />
Management, Education,<br />
Health Care <strong>and</strong> social<br />
assistance<br />
8%<br />
Source: U.S. Department <strong>of</strong> Commerce, Bureau <strong>of</strong> <strong>Economic</strong> Analysis, 2007<br />
52<br />
Other services, except<br />
public administration<br />
5%<br />
Manufacturing 26%<br />
Construction<br />
15%<br />
Governm ent<br />
12%<br />
Trade<br />
10%<br />
Refugio<br />
Refugio County is located on the lower Gulf Coast <strong>and</strong> is the least populated<br />
<strong>and</strong> the slowest growing County in the San Antonio Bay area. <strong>The</strong> population has<br />
decreased since 1980. In the decade from 1980 to 1990 the population<br />
decreased approximately 14 percent. From 1990 to 2000 the growth rate was<br />
negative 1.86 percent. From 2000 to 2006, Refugio experienced a negative<br />
population growth rate <strong>of</strong> 3 percent (Table 5-1).<br />
<strong>The</strong> age distribution indicates that the County’s population is also older than<br />
the State’s. In 2005, 29.80 percent <strong>of</strong> the population were 18 <strong>and</strong> under, 53<br />
percent were between the ages <strong>of</strong> 19 <strong>and</strong> 65 <strong>and</strong> 17.20 percent <strong>of</strong> the population<br />
were 65 <strong>and</strong> older (Table 5-2).<br />
<strong>The</strong> ethnicity distribution estimated for 2005 indicates that 47.90 percent <strong>of</strong><br />
people were Caucasian (not–Hispanic), 6.70 percent were Black (not–Hispanic),<br />
44.70 percent were <strong>of</strong> Hispanic or Latin origin <strong>and</strong> 1.30 percent were <strong>of</strong> other<br />
races (Table 5-3).<br />
<strong>The</strong> County has the lowest educational attainment <strong>of</strong> the adult population <strong>of</strong><br />
the counties analyzed. In 2000, 68.10 percent <strong>of</strong> persons with age 25 <strong>and</strong> older<br />
completed High School <strong>and</strong> 11 percent <strong>of</strong> people in this age group had a<br />
Bachelor’s degree (Table 5-4).


