

The Economic Value of Water and Ecosystem Preservation
The Economic Value of Water and Ecosystem Preservation
The Economic Value of Water and Ecosystem Preservation

You also want an ePaper? Increase the reach of your titles
YUMPU automatically turns print PDFs into web optimized ePapers that Google loves.
IM<br />
t+<br />
n<br />
ic<br />
= E<br />
t<br />
ic<br />
⎡⎛<br />
E<br />
× ⎢⎜<br />
⎜<br />
⎢⎣<br />
⎝ E<br />
t+<br />
n<br />
iUS<br />
t<br />
iUS<br />
t ⎞ ⎛ E<br />
⎟<br />
− ⎜<br />
t<br />
⎠ ⎝ E<br />
+ n<br />
US<br />
US<br />
⎞⎤<br />
⎟<br />
⎥<br />
⎠⎥⎦<br />
t + n = current time period<br />
i = industry<br />
55<br />
t = base year<br />
c = County<br />
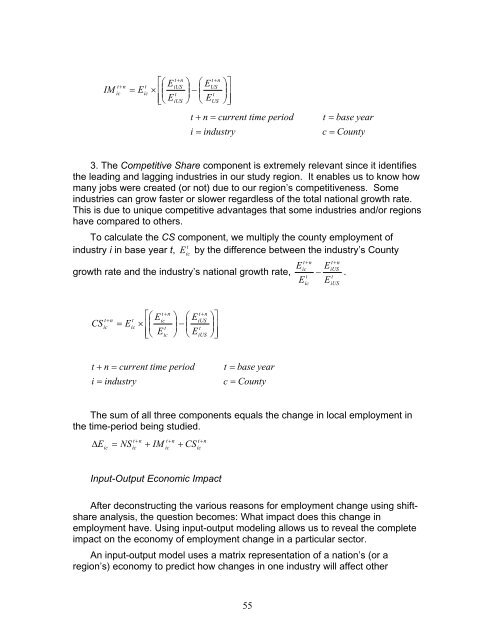
3. <strong>The</strong> Competitive Share component is extremely relevant since it identifies<br />
the leading <strong>and</strong> lagging industries in our study region. It enables us to know how<br />
many jobs were created (or not) due to our region’s competitiveness. Some<br />
industries can grow faster or slower regardless <strong>of</strong> the total national growth rate.<br />
This is due to unique competitive advantages that some industries <strong>and</strong>/or regions<br />
have compared to others.<br />
To calculate the CS component, we multiply the county employment <strong>of</strong><br />
t<br />
industry i in base year t, E ic by the difference between the industry’s County<br />
t+<br />
n t+<br />
n<br />
Eic<br />
EiUS<br />
growth rate <strong>and</strong> the industry’s national growth rate, − .<br />
t t<br />
E E<br />
CS<br />
t+<br />
n<br />
ic<br />
= E<br />
t<br />
ic<br />
i = industry<br />
t ⎡⎛<br />
E<br />
× ⎢ ⎜<br />
⎢⎣<br />
⎝ E<br />
+ n<br />
ic<br />
t<br />
ic<br />
⎞ ⎛ E<br />
⎟ −<br />
⎜<br />
⎠ ⎝ E<br />
t + n = current time period<br />
t+<br />
n<br />
iUS<br />
t<br />
iUS<br />
⎞⎤<br />
⎟<br />
⎟⎥<br />
⎠⎥⎦<br />
t = base year<br />
c = County<br />
<strong>The</strong> sum <strong>of</strong> all three components equals the change in local employment in<br />
the time-period being studied.<br />
Δ E<br />
ic<br />
= NS<br />
t+<br />
n<br />
ic<br />
+ IM<br />
t+<br />
n<br />
ic<br />
+ CS<br />
t+<br />
n<br />
ic<br />
Input-Output <strong>Economic</strong> Impact<br />
After deconstructing the various reasons for employment change using shiftshare<br />
analysis, the question becomes: What impact does this change in<br />
employment have. Using input-output modeling allows us to reveal the complete<br />
impact on the economy <strong>of</strong> employment change in a particular sector.<br />
An input-output model uses a matrix representation <strong>of</strong> a nation’s (or a<br />
region’s) economy to predict how changes in one industry will affect other<br />
ic<br />
iUS


