

The Economic Value of Water and Ecosystem Preservation
The Economic Value of Water and Ecosystem Preservation
The Economic Value of Water and Ecosystem Preservation

Create successful ePaper yourself
Turn your PDF publications into a flip-book with our unique Google optimized e-Paper software.
Boating 46%<br />
Nature 65%<br />
Camping 43%<br />
Photo 41%<br />
Hiking 48%<br />
Birding 62%<br />
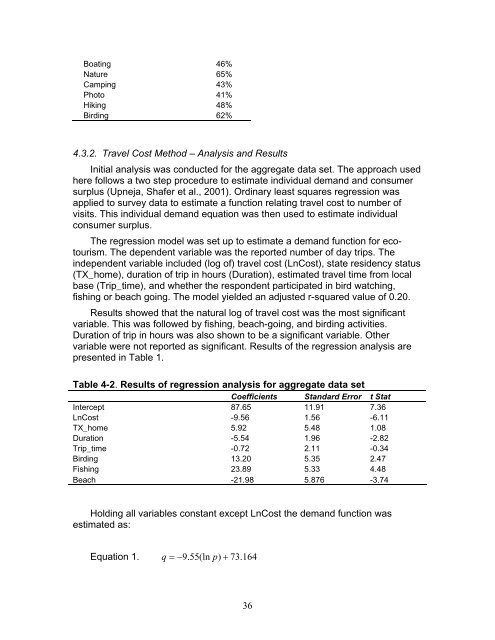
4.3.2. Travel Cost Method – Analysis <strong>and</strong> Results<br />
Initial analysis was conducted for the aggregate data set. <strong>The</strong> approach used<br />
here follows a two step procedure to estimate individual dem<strong>and</strong> <strong>and</strong> consumer<br />
surplus (Upneja, Shafer et al., 2001). Ordinary least squares regression was<br />
applied to survey data to estimate a function relating travel cost to number <strong>of</strong><br />
visits. This individual dem<strong>and</strong> equation was then used to estimate individual<br />
consumer surplus.<br />
<strong>The</strong> regression model was set up to estimate a dem<strong>and</strong> function for ecotourism.<br />
<strong>The</strong> dependent variable was the reported number <strong>of</strong> day trips. <strong>The</strong><br />
independent variable included (log <strong>of</strong>) travel cost (LnCost), state residency status<br />
(TX_home), duration <strong>of</strong> trip in hours (Duration), estimated travel time from local<br />
base (Trip_time), <strong>and</strong> whether the respondent participated in bird watching,<br />
fishing or beach going. <strong>The</strong> model yielded an adjusted r-squared value <strong>of</strong> 0.20.<br />
Results showed that the natural log <strong>of</strong> travel cost was the most significant<br />
variable. This was followed by fishing, beach-going, <strong>and</strong> birding activities.<br />
Duration <strong>of</strong> trip in hours was also shown to be a significant variable. Other<br />
variable were not reported as significant. Results <strong>of</strong> the regression analysis are<br />
presented in Table 1.<br />
Table 4-2. Results <strong>of</strong> regression analysis for aggregate data set<br />
Coefficients St<strong>and</strong>ard Error t Stat<br />
Intercept 87.65 11.91 7.36<br />
LnCost -9.56 1.56 -6.11<br />
TX_home 5.92 5.48 1.08<br />
Duration -5.54 1.96 -2.82<br />
Trip_time -0.72 2.11 -0.34<br />
Birding 13.20 5.35 2.47<br />
Fishing 23.89 5.33 4.48<br />
Beach -21.98 5.876 -3.74<br />
Holding all variables constant except LnCost the dem<strong>and</strong> function was<br />
estimated as:<br />
Equation 1. q<br />
= −9<br />
. 55(ln<br />
p)<br />
+ 73.<br />
164<br />
36


