Embedded Systems Design with the Atmel AVR Microcontroller Part II
Embedded Systems Design with the Atmel AVR Microcontroller Part II
Embedded Systems Design with the Atmel AVR Microcontroller Part II

Create successful ePaper yourself
Turn your PDF publications into a flip-book with our unique Google optimized e-Paper software.
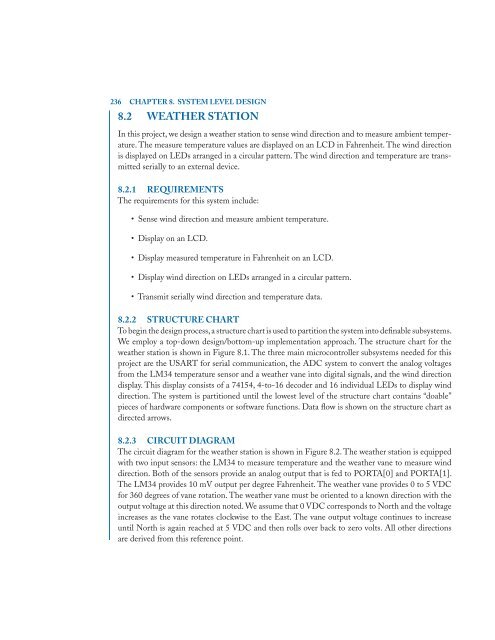
236 CHAPTER 8. SYSTEM LEVEL DESIGN<br />
8.2 WEATHER STATION<br />
In this project, we design a wea<strong>the</strong>r station to sense wind direction and to measure ambient temperature.<br />
The measure temperature values are displayed on an LCD in Fahrenheit. The wind direction<br />
is displayed on LEDs arranged in a circular pattern. The wind direction and temperature are transmitted<br />
serially to an external device.<br />
8.2.1 REQUIREMENTS<br />
The requirements for this system include:<br />
Sense wind direction and measure ambient temperature.<br />
Display on an LCD.<br />
Display measured temperature in Fahrenheit on an LCD.<br />
Display wind direction on LEDs arranged in a circular pattern.<br />
Transmit serially wind direction and temperature data.<br />
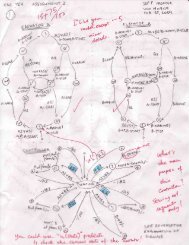
8.2.2 STRUCTURE CHART<br />
To begin <strong>the</strong> design process,a structure chart is used to partition <strong>the</strong> system into definable subsystems.<br />
We employ a top-down design/bottom-up implementation approach. The structure chart for <strong>the</strong><br />
wea<strong>the</strong>r station is shown in Figure 8.1. The three main microcontroller subsystems needed for this<br />
project are <strong>the</strong> USART for serial communication, <strong>the</strong> ADC system to convert <strong>the</strong> analog voltages<br />
from <strong>the</strong> LM34 temperature sensor and a wea<strong>the</strong>r vane into digital signals, and <strong>the</strong> wind direction<br />
display. This display consists of a 74154, 4-to-16 decoder and 16 individual LEDs to display wind<br />
direction. The system is partitioned until <strong>the</strong> lowest level of <strong>the</strong> structure chart contains “doable”<br />
pieces of hardware components or software functions. Data flow is shown on <strong>the</strong> structure chart as<br />
directed arrows.<br />
8.2.3 CIRCUIT DIAGRAM<br />
The circuit diagram for <strong>the</strong> wea<strong>the</strong>r station is shown in Figure 8.2. The wea<strong>the</strong>r station is equipped<br />
<strong>with</strong> two input sensors: <strong>the</strong> LM34 to measure temperature and <strong>the</strong> wea<strong>the</strong>r vane to measure wind<br />
direction. Both of <strong>the</strong> sensors provide an analog output that is fed to PORTA[0] and PORTA[1].<br />
The LM34 provides 10 mV output per degree Fahrenheit. The wea<strong>the</strong>r vane provides 0 to 5 VDC<br />
for 360 degrees of vane rotation. The wea<strong>the</strong>r vane must be oriented to a known direction <strong>with</strong> <strong>the</strong><br />
output voltage at this direction noted. We assume that 0 VDC corresponds to North and <strong>the</strong> voltage<br />
increases as <strong>the</strong> vane rotates clockwise to <strong>the</strong> East. The vane output voltage continues to increase<br />
until North is again reached at 5 VDC and <strong>the</strong>n rolls over back to zero volts. All o<strong>the</strong>r directions<br />
are derived from this reference point.