Identification of the major drivers of 'phenolic' taste in ... - GWRDC
Identification of the major drivers of 'phenolic' taste in ... - GWRDC
Identification of the major drivers of 'phenolic' taste in ... - GWRDC

You also want an ePaper? Increase the reach of your titles
YUMPU automatically turns print PDFs into web optimized ePapers that Google loves.
AWRI: <strong>Identification</strong> Of The Major Drivers Of ‘Phenolic’ Taste In White W<strong>in</strong>es<br />
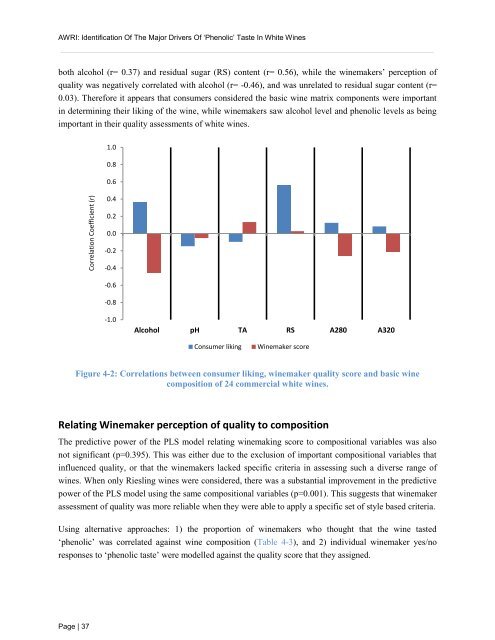
both alcohol (r= 0.37) and residual sugar (RS) content (r= 0.56), while <strong>the</strong> w<strong>in</strong>emakers’ perception <strong>of</strong><br />
quality was negatively correlated with alcohol (r= -0.46), and was unrelated to residual sugar content (r=<br />
0.03). Therefore it appears that consumers considered <strong>the</strong> basic w<strong>in</strong>e matrix components were important<br />
<strong>in</strong> determ<strong>in</strong><strong>in</strong>g <strong>the</strong>ir lik<strong>in</strong>g <strong>of</strong> <strong>the</strong> w<strong>in</strong>e, while w<strong>in</strong>emakers saw alcohol level and phenolic levels as be<strong>in</strong>g<br />
important <strong>in</strong> <strong>the</strong>ir quality assessments <strong>of</strong> white w<strong>in</strong>es.<br />
Correlation Coefficient (r)<br />
Page | 37<br />
1.0<br />
0.8<br />
0.6<br />
0.4<br />
0.2<br />
0.0<br />
-0.2<br />
-0.4<br />
-0.6<br />
-0.8<br />
-1.0<br />
Alcohol pH TA RS A280 A320<br />
Consumer lik<strong>in</strong>g W<strong>in</strong>emaker score<br />
Figure 4-2: Correlations between consumer lik<strong>in</strong>g, w<strong>in</strong>emaker quality score and basic w<strong>in</strong>e<br />
composition <strong>of</strong> 24 commercial white w<strong>in</strong>es.<br />
Relat<strong>in</strong>g W<strong>in</strong>emaker perception <strong>of</strong> quality to composition<br />
The predictive power <strong>of</strong> <strong>the</strong> PLS model relat<strong>in</strong>g w<strong>in</strong>emak<strong>in</strong>g score to compositional variables was also<br />
not significant (p=0.395). This was ei<strong>the</strong>r due to <strong>the</strong> exclusion <strong>of</strong> important compositional variables that<br />
<strong>in</strong>fluenced quality, or that <strong>the</strong> w<strong>in</strong>emakers lacked specific criteria <strong>in</strong> assess<strong>in</strong>g such a diverse range <strong>of</strong><br />
w<strong>in</strong>es. When only Riesl<strong>in</strong>g w<strong>in</strong>es were considered, <strong>the</strong>re was a substantial improvement <strong>in</strong> <strong>the</strong> predictive<br />
power <strong>of</strong> <strong>the</strong> PLS model us<strong>in</strong>g <strong>the</strong> same compositional variables (p=0.001). This suggests that w<strong>in</strong>emaker<br />
assessment <strong>of</strong> quality was more reliable when <strong>the</strong>y were able to apply a specific set <strong>of</strong> style based criteria.<br />
Us<strong>in</strong>g alternative approaches: 1) <strong>the</strong> proportion <strong>of</strong> w<strong>in</strong>emakers who thought that <strong>the</strong> w<strong>in</strong>e <strong>taste</strong>d<br />
‘phenolic’ was correlated aga<strong>in</strong>st w<strong>in</strong>e composition (Table 4-3), and 2) <strong>in</strong>dividual w<strong>in</strong>emaker yes/no<br />
responses to ‘phenolic <strong>taste</strong>’ were modelled aga<strong>in</strong>st <strong>the</strong> quality score that <strong>the</strong>y assigned.