Identification of the major drivers of 'phenolic' taste in ... - GWRDC
Identification of the major drivers of 'phenolic' taste in ... - GWRDC
Identification of the major drivers of 'phenolic' taste in ... - GWRDC

Create successful ePaper yourself
Turn your PDF publications into a flip-book with our unique Google optimized e-Paper software.
AWRI: <strong>Identification</strong> Of The Major Drivers Of ‘Phenolic’ Taste In White W<strong>in</strong>es<br />
87<br />
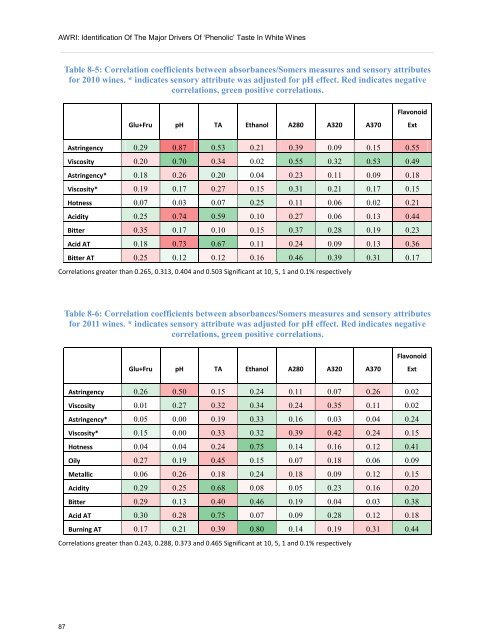
Table 8-5: Correlation coefficients between absorbances/Somers measures and sensory attributes<br />
for 2010 w<strong>in</strong>es. * <strong>in</strong>dicates sensory attribute was adjusted for pH effect. Red <strong>in</strong>dicates negative<br />
correlations, green positive correlations.<br />
Glu+Fru pH TA Ethanol A280 A320 A370<br />
Flavonoid<br />
Astr<strong>in</strong>gency 0.29 0.87 0.53 0.21 0.39 0.09 0.15 0.55<br />
Viscosity 0.20 0.70 0.34 0.02 0.55 0.32 0.53 0.49<br />
Astr<strong>in</strong>gency* 0.18 0.26 0.20 0.04 0.23 0.11 0.09 0.18<br />
Viscosity* 0.19 0.17 0.27 0.15 0.31 0.21 0.17 0.15<br />
Hotness 0.07 0.03 0.07 0.25 0.11 0.06 0.02 0.21<br />
Acidity 0.25 0.74 0.59 0.10 0.27 0.06 0.13 0.44<br />
Bitter 0.35 0.17 0.10 0.15 0.37 0.28 0.19 0.23<br />
Acid AT 0.18 0.73 0.67 0.11 0.24 0.09 0.13 0.36<br />
Bitter AT 0.25 0.12 0.12 0.16 0.46 0.39 0.31 0.17<br />
Correlations greater than 0.265, 0.313, 0.404 and 0.503 Significant at 10, 5, 1 and 0.1% respectively<br />
Table 8-6: Correlation coefficients between absorbances/Somers measures and sensory attributes<br />
for 2011 w<strong>in</strong>es. * <strong>in</strong>dicates sensory attribute was adjusted for pH effect. Red <strong>in</strong>dicates negative<br />
correlations, green positive correlations.<br />
Glu+Fru pH TA Ethanol A280 A320 A370<br />
Ext<br />
Flavonoid<br />
Astr<strong>in</strong>gency 0.26 0.50 0.15 0.24 0.11 0.07 0.26 0.02<br />
Viscosity 0.01 0.27 0.32 0.34 0.24 0.35 0.11 0.02<br />
Astr<strong>in</strong>gency* 0.05 0.00 0.19 0.33 0.16 0.03 0.04 0.24<br />
Viscosity* 0.15 0.00 0.33 0.32 0.39 0.42 0.24 0.15<br />
Hotness 0.04 0.04 0.24 0.75 0.14 0.16 0.12 0.41<br />
Oily 0.27 0.19 0.45 0.15 0.07 0.18 0.06 0.09<br />
Metallic 0.06 0.26 0.18 0.24 0.18 0.09 0.12 0.15<br />
Acidity 0.29 0.25 0.68 0.08 0.05 0.23 0.16 0.20<br />
Bitter 0.29 0.13 0.40 0.46 0.19 0.04 0.03 0.38<br />
Acid AT 0.30 0.28 0.75 0.07 0.09 0.28 0.12 0.18<br />
Burn<strong>in</strong>g AT 0.17 0.21 0.39 0.80 0.14 0.19 0.31 0.44<br />
Correlations greater than 0.243, 0.288, 0.373 and 0.465 Significant at 10, 5, 1 and 0.1% respectively<br />
Ext