Identification of the major drivers of 'phenolic' taste in ... - GWRDC
Identification of the major drivers of 'phenolic' taste in ... - GWRDC
Identification of the major drivers of 'phenolic' taste in ... - GWRDC

Create successful ePaper yourself
Turn your PDF publications into a flip-book with our unique Google optimized e-Paper software.
AWRI: <strong>Identification</strong> Of The Major Drivers Of ‘Phenolic’ Taste In White W<strong>in</strong>es<br />
Correlation coefficient (r)<br />
92<br />
1.0<br />
0.8<br />
0.6<br />
0.4<br />
0.2<br />
0.0<br />
-0.2<br />
-0.4<br />
-0.6<br />
-0.8<br />
-1.0<br />
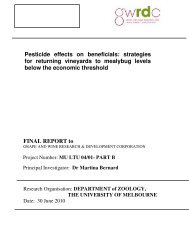
Figure 8-22: Correlation coefficients between concentration <strong>of</strong> phenolic compound classes and<br />
sensory attributes. All 2010 w<strong>in</strong>es. * <strong>in</strong>dicates sensory attribute was adjusted for pH effect<br />
Good associations were seen between bitter and bitter after<strong>taste</strong> character and A280 <strong>in</strong> 2010 (Table 8-5).<br />
The concentrations <strong>of</strong> many <strong>of</strong> <strong>the</strong> phenolic groups were associated with bitter after<strong>taste</strong> (Figure 8-22).<br />
PLS regression analysis showed that a significant contributor to <strong>the</strong> relationship were <strong>the</strong> flavan-3-ols,<br />
benzoic acids and to a lesser extent GRP and <strong>the</strong> c<strong>in</strong>namic acids. Flavan-3-ols were found to be abundant<br />
<strong>in</strong> one <strong>of</strong> <strong>the</strong> few bitter fractions extracted from commercial w<strong>in</strong>es (Chapter 6), and have been reported to<br />
be important bitter compounds <strong>in</strong> tea (Narukawa et al. 2010). Add<strong>in</strong>g GRP and caftaric acid to model<br />
w<strong>in</strong>e did not result <strong>in</strong> a consistent <strong>in</strong>crease <strong>in</strong> bitterness (Chapter 7). PLS analysis suggested that GRP and<br />
caftaric acid have some <strong>in</strong>fluence on bitterness. However, it is reasonable to assume that <strong>the</strong> direct<br />
approach <strong>of</strong> assess<strong>in</strong>g <strong>the</strong>se compounds <strong>in</strong> isolation will be more robust than us<strong>in</strong>g correlative methods<br />
such as PLS.<br />
Astr<strong>in</strong>gency* Viscosity* Hotness Acidity Bitter AT Acid AT<br />
Benzoic acids Benzoic acid glycosides<br />
Benzoic acid ethyl esters GRP's<br />
C<strong>in</strong>namic acids C<strong>in</strong>namic acid glycosides<br />
C<strong>in</strong>namic acid ethyl esters Phenols<br />
Total peak area measured at 280 nm has been used as a proxy for total phenolics and was correlated<br />
aga<strong>in</strong>st sensory rat<strong>in</strong>gs given to <strong>the</strong> 2010 w<strong>in</strong>es (Figure 8-24). Astr<strong>in</strong>gency (adjusted for pH effect),<br />
hotness and acidity were negatively correlated with peak area, while viscosity (adjusted for pH effect) and<br />
bitter after<strong>taste</strong>s were positively correlated with peak area.