Identification of the major drivers of 'phenolic' taste in ... - GWRDC
Identification of the major drivers of 'phenolic' taste in ... - GWRDC
Identification of the major drivers of 'phenolic' taste in ... - GWRDC

You also want an ePaper? Increase the reach of your titles
YUMPU automatically turns print PDFs into web optimized ePapers that Google loves.
AWRI: <strong>Identification</strong> Of The Major Drivers Of ‘Phenolic’ Taste In White W<strong>in</strong>es<br />
and syr<strong>in</strong>gic acid ra<strong>the</strong>r than <strong>the</strong> flavan-3-ols. Here, <strong>of</strong> <strong>the</strong> two fractions that conta<strong>in</strong>ed reasonable<br />
quantities <strong>of</strong> caffeic acid ethyl ester, one was more bitter than <strong>the</strong> control (Fiano F2) and one was less<br />
bitter (Fiano F1). Fur<strong>the</strong>rmore, <strong>the</strong> <strong>in</strong>terpretation is confounded by <strong>the</strong> fact that Fiano F2 also conta<strong>in</strong>ed<br />
significant quantities <strong>of</strong> monomeric flavanols as well as hydroxyc<strong>in</strong>namic ethyl esters.<br />
In a previous trial (Chapter 3), add<strong>in</strong>g whole phenolics extracted from w<strong>in</strong>es and added to commercial<br />
base w<strong>in</strong>es were shown to result <strong>in</strong> <strong>in</strong>creases <strong>in</strong> most sensory attributes related to phenolic <strong>taste</strong>. However<br />
<strong>in</strong> this study where phenolic fractions were added, we ma<strong>in</strong>ly saw a suppression <strong>of</strong> phenolic <strong>taste</strong>s. In<br />
previous work we have used w<strong>in</strong>es with a reasonable amount <strong>of</strong> phenolics as <strong>the</strong> base, while <strong>in</strong> this study<br />
we have utilised a base w<strong>in</strong>e that had been stripped <strong>of</strong> most <strong>of</strong> its phenolics. While <strong>the</strong> possibility that<br />
phenolic compounds may synergise to accentuate phenolic <strong>taste</strong>s cannot be ruled out, to our knowledge<br />
this has not previously been reported.<br />
6.3.2 Modell<strong>in</strong>g Taste and Textures on Absorbance Measures at 280,<br />
320 and 370 nm<br />
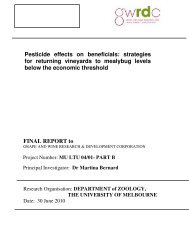
PLS modelled <strong>the</strong> burn<strong>in</strong>g sensation on A280, A320 and A370 very well (p model fit = 0.048, Figure 6.2).<br />
The burn<strong>in</strong>g sensation was heavily negatively weighted on A320 (i.e. total hydroxyc<strong>in</strong>namates), and<br />
strongly positively weighted on A370. HPLC showed that quercet<strong>in</strong>-3-glucuronide made up 90% <strong>of</strong> <strong>the</strong><br />
active compounds at this wavelength <strong>in</strong> most <strong>of</strong> <strong>the</strong> fractions, which suggests that this compound may<br />
play a role <strong>in</strong> <strong>the</strong> perception <strong>of</strong> this sensation. However, <strong>the</strong> relationship between <strong>the</strong> total absorbance at a<br />
particular wavelength and <strong>the</strong> relationship between that and specific compounds is tentative.<br />
Page | 53<br />
PLS Coefficient<br />
2.5<br />
2.0<br />
1.5<br />
1.0<br />
0.5<br />
0.0<br />
-0.5<br />
-1.0<br />
-1.5<br />
-2.0<br />
Astr<strong>in</strong>gency<br />
(0.676)<br />
Viscosity<br />
(0.631)<br />
Bitterness<br />
(0.431)<br />
Burn<strong>in</strong>g<br />
(0.048)<br />
A280<br />
A320<br />
A370<br />
Figure 6-2: PLS regression coefficients modell<strong>in</strong>g sensory attribute rat<strong>in</strong>gs on analytical<br />
parameters. Significance <strong>of</strong> model fit given <strong>in</strong> paren<strong>the</strong>sis.