Report - Oregon State Library: State Employee Information Center ...
Report - Oregon State Library: State Employee Information Center ...
Report - Oregon State Library: State Employee Information Center ...

Create successful ePaper yourself
Turn your PDF publications into a flip-book with our unique Google optimized e-Paper software.
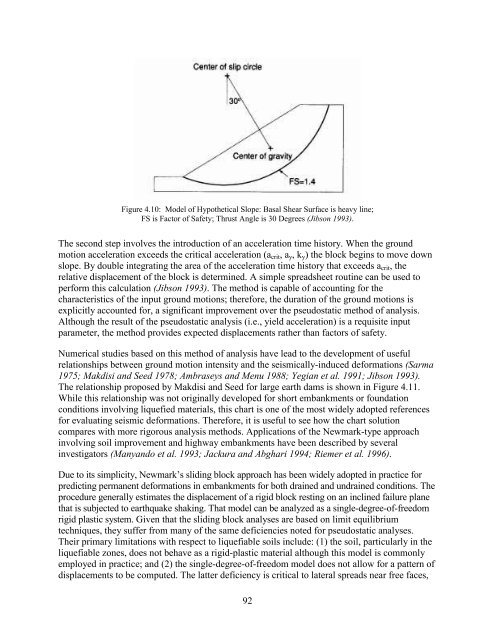
Figure 4.10: Model of Hypothetical Slope: Basal Shear Surface is heavy line;<br />
FS is Factor of Safety; Thrust Angle is 30 Degrees (Jibson 1993).<br />
The second step involves the introduction of an acceleration time history. When the ground<br />
motion acceleration exceeds the critical acceleration (a crit , a y , k y ) the block begins to move down<br />
slope. By double integrating the area of the acceleration time history that exceeds a crit , the<br />
relative displacement of the block is determined. A simple spreadsheet routine can be used to<br />
perform this calculation (Jibson 1993). The method is capable of accounting for the<br />
characteristics of the input ground motions; therefore, the duration of the ground motions is<br />
explicitly accounted for, a significant improvement over the pseudostatic method of analysis.<br />
Although the result of the pseudostatic analysis (i.e., yield acceleration) is a requisite input<br />
parameter, the method provides expected displacements rather than factors of safety.<br />
Numerical studies based on this method of analysis have lead to the development of useful<br />
relationships between ground motion intensity and the seismically-induced deformations (Sarma<br />
1975; Makdisi and Seed 1978; Ambraseys and Menu 1988; Yegian et al. 1991; Jibson 1993).<br />
The relationship proposed by Makdisi and Seed for large earth dams is shown in Figure 4.11.<br />
While this relationship was not originally developed for short embankments or foundation<br />
conditions involving liquefied materials, this chart is one of the most widely adopted references<br />
for evaluating seismic deformations. Therefore, it is useful to see how the chart solution<br />
compares with more rigorous analysis methods. Applications of the Newmark-type approach<br />
involving soil improvement and highway embankments have been described by several<br />
investigators (Manyando et al. 1993; Jackura and Abghari 1994; Riemer et al. 1996).<br />
Due to its simplicity, Newmark’s sliding block approach has been widely adopted in practice for<br />
predicting permanent deformations in embankments for both drained and undrained conditions. The<br />
procedure generally estimates the displacement of a rigid block resting on an inclined failure plane<br />
that is subjected to earthquake shaking. That model can be analyzed as a single-degree-of-freedom<br />
rigid plastic system. Given that the sliding block analyses are based on limit equilibrium<br />
techniques, they suffer from many of the same deficiencies noted for pseudostatic analyses.<br />
Their primary limitations with respect to liquefiable soils include: (1) the soil, particularly in the<br />
liquefiable zones, does not behave as a rigid-plastic material although this model is commonly<br />
employed in practice; and (2) the single-degree-of-freedom model does not allow for a pattern of<br />
displacements to be computed. The latter deficiency is critical to lateral spreads near free faces,<br />
92