Report - Oregon State Library: State Employee Information Center ...
Report - Oregon State Library: State Employee Information Center ...
Report - Oregon State Library: State Employee Information Center ...

Create successful ePaper yourself
Turn your PDF publications into a flip-book with our unique Google optimized e-Paper software.
Attenuation relationships were used to predict both PGA and spectral acceleration response<br />
content of each type of earthquake. Once the PGA and spectral response of the ground motions<br />
were determined, time history records of like events were selected for use in the dynamic ground<br />
response analysis. An effort was made to match distance, magnitude, spectral content and PGA<br />
for all input time histories with those of the predicted values, though the inherent variability in<br />
earthquakes motions do not allow for complete agreement with the smoothed spectra provided<br />
from the regression analyses on which the attenuation relationships are based.<br />
8.4.1 Summary of Recent Seismic Hazard Investigations<br />
Comparisons were made between the recommendations of the PGA on soil and rock from the<br />
following sources: (1) the Geomatrix (1995) report to the ODOT titled, Seismic Design Mapping<br />
of the <strong>State</strong> of <strong>Oregon</strong>, (2) the USGS’s National Seismic Mapping Project (USGS 2000), and (3)<br />
the URS Greiner/Woodward Clyde Portland Microzonation Maps (Wong et al. 2000). These<br />
recommendations are based on probabilistic, uniform hazard studies that combined the ground<br />
shaking contributions from the interplate, intraplate, and crustal earthquake scenarios,<br />
respectively, into one peak ground acceleration value for a given return period (Table 8.3). It<br />
should be noted that investigations by Geomatrix and the USGS provide recommendations for<br />
PGA on bedrock. The URS Greiner/Woodward Clyde report yields PGA values at the soil<br />
surface. The recommendations put forth in the URS Greiner/Woodward Clyde report,<br />
specifically the Portland area fault map shown in Figure 8.3, were incorporated into this<br />
demonstration application for the sake of completeness.<br />
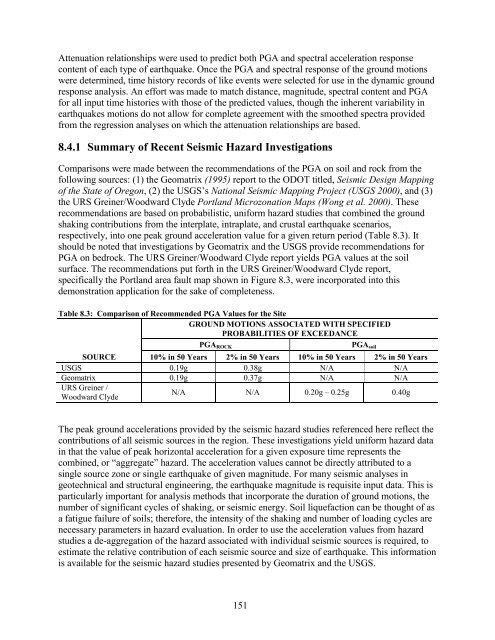
Table 8.3: Comparison of Recommended PGA Values for the Site<br />
GROUND MOTIONS ASSOCIATED WITH SPECIFIED<br />
PROBABILITIES OF EXCEEDANCE<br />
PGA ROCK<br />
PGA soil<br />
SOURCE 10% in 50 Years 2% in 50 Years 10% in 50 Years 2% in 50 Years<br />
USGS 0.19g 0.38g N/A N/A<br />
Geomatrix 0.19g 0.37g N/A N/A<br />
URS Greiner /<br />
Woodward Clyde<br />
N/A N/A 0.20g – 0.25g 0.40g<br />
The peak ground accelerations provided by the seismic hazard studies referenced here reflect the<br />
contributions of all seismic sources in the region. These investigations yield uniform hazard data<br />
in that the value of peak horizontal acceleration for a given exposure time represents the<br />
combined, or “aggregate” hazard. The acceleration values cannot be directly attributed to a<br />
single source zone or single earthquake of given magnitude. For many seismic analyses in<br />
geotechnical and structural engineering, the earthquake magnitude is requisite input data. This is<br />
particularly important for analysis methods that incorporate the duration of ground motions, the<br />
number of significant cycles of shaking, or seismic energy. Soil liquefaction can be thought of as<br />
a fatigue failure of soils; therefore, the intensity of the shaking and number of loading cycles are<br />
necessary parameters in hazard evaluation. In order to use the acceleration values from hazard<br />
studies a de-aggregation of the hazard associated with individual seismic sources is required, to<br />
estimate the relative contribution of each seismic source and size of earthquake. This information<br />
is available for the seismic hazard studies presented by Geomatrix and the USGS.<br />
151