Report - Oregon State Library: State Employee Information Center ...
Report - Oregon State Library: State Employee Information Center ...
Report - Oregon State Library: State Employee Information Center ...

Create successful ePaper yourself
Turn your PDF publications into a flip-book with our unique Google optimized e-Paper software.
8.4.2 Subduction Zone Bedrock Motions<br />
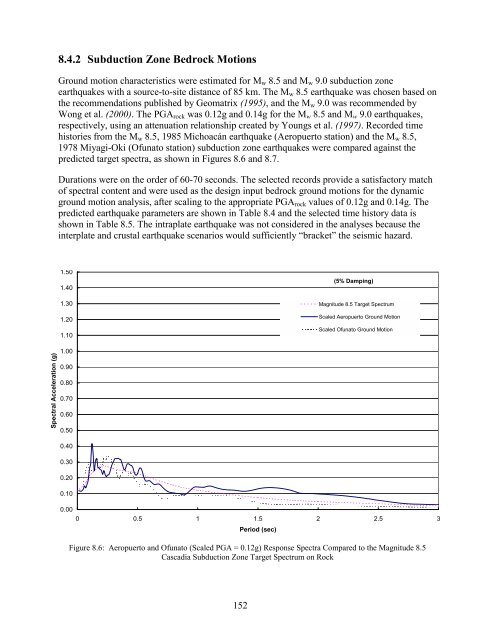
Ground motion characteristics were estimated for M w 8.5 and M w 9.0 subduction zone<br />
earthquakes with a source-to-site distance of 85 km. The M w 8.5 earthquake was chosen based on<br />
the recommendations published by Geomatrix (1995), and the M w 9.0 was recommended by<br />
Wong et al. (2000). The PGA rock was 0.12g and 0.14g for the M w 8.5 and M w 9.0 earthquakes,<br />
respectively, using an attenuation relationship created by Youngs et al. (1997). Recorded time<br />
histories from the M w 8.5, 1985 Michoacán earthquake (Aeropuerto station) and the M w 8.5,<br />
1978 Miyagi-Oki (Ofunato station) subduction zone earthquakes were compared against the<br />
predicted target spectra, as shown in Figures 8.6 and 8.7.<br />
Durations were on the order of 60-70 seconds. The selected records provide a satisfactory match<br />
of spectral content and were used as the design input bedrock ground motions for the dynamic<br />
ground motion analysis, after scaling to the appropriate PGA rock values of 0.12g and 0.14g. The<br />
predicted earthquake parameters are shown in Table 8.4 and the selected time history data is<br />
shown in Table 8.5. The intraplate earthquake was not considered in the analyses because the<br />
interplate and crustal earthquake scenarios would sufficiently “bracket” the seismic hazard.<br />
1.50<br />
1.40<br />
1.30<br />
1.20<br />
1.10<br />
(5% Damping)<br />
Magnitude 8.5 Target Spectrum<br />
Scaled Aeropuerto Ground Motion<br />
Scaled Ofunato Ground Motion<br />
Spectral Acceleration (g)<br />
1.00<br />
0.90<br />
0.80<br />
0.70<br />
0.60<br />
0.50<br />
0.40<br />
0.30<br />
0.20<br />
0.10<br />
0.00<br />
0 0.5 1 1.5 2 2.5 3<br />
Period (sec)<br />
Figure 8.6: Aeropuerto and Ofunato (Scaled PGA = 0.12g) Response Spectra Compared to the Magnitude 8.5<br />
Cascadia Subduction Zone Target Spectrum on Rock<br />
152