Report - Oregon State Library: State Employee Information Center ...
Report - Oregon State Library: State Employee Information Center ...
Report - Oregon State Library: State Employee Information Center ...

Create successful ePaper yourself
Turn your PDF publications into a flip-book with our unique Google optimized e-Paper software.
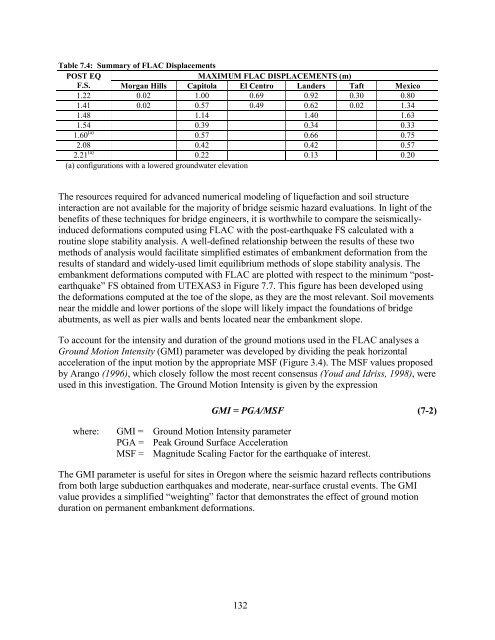
Table 7.4: Summary of FLAC Displacements<br />
POST EQ<br />
MAXIMUM FLAC DISPLACEMENTS (m)<br />
F.S. Morgan Hills Capitola El Centro Landers Taft Mexico<br />
1.22 0.02 1.00 0.69 0.92 0.30 0.80<br />
1.41 0.02 0.57 0.49 0.62 0.02 1.34<br />
1.48 1.14 1.40 1.63<br />
1.54 0.39 0.34 0.33<br />
1.60 (a) 0.57 0.66 0.75<br />
2.08 0.42 0.42 0.57<br />
2.21 (a) 0.22 0.13 0.20<br />
(a) configurations with a lowered groundwater elevation<br />
The resources required for advanced numerical modeling of liquefaction and soil structure<br />
interaction are not available for the majority of bridge seismic hazard evaluations. In light of the<br />
benefits of these techniques for bridge engineers, it is worthwhile to compare the seismicallyinduced<br />
deformations computed using FLAC with the post-earthquake FS calculated with a<br />
routine slope stability analysis. A well-defined relationship between the results of these two<br />
methods of analysis would facilitate simplified estimates of embankment deformation from the<br />
results of standard and widely-used limit equilibrium methods of slope stability analysis. The<br />
embankment deformations computed with FLAC are plotted with respect to the minimum “postearthquake”<br />
FS obtained from UTEXAS3 in Figure 7.7. This figure has been developed using<br />
the deformations computed at the toe of the slope, as they are the most relevant. Soil movements<br />
near the middle and lower portions of the slope will likely impact the foundations of bridge<br />
abutments, as well as pier walls and bents located near the embankment slope.<br />
To account for the intensity and duration of the ground motions used in the FLAC analyses a<br />
Ground Motion Intensity (GMI) parameter was developed by dividing the peak horizontal<br />
acceleration of the input motion by the appropriate MSF (Figure 3.4). The MSF values proposed<br />
by Arango (1996), which closely follow the most recent consensus (Youd and Idriss, 1998), were<br />
used in this investigation. The Ground Motion Intensity is given by the expression<br />
GMI = PGA/MSF (7-2)<br />
where:<br />
GMI = Ground Motion Intensity parameter<br />
PGA = Peak Ground Surface Acceleration<br />
MSF = Magnitude Scaling Factor for the earthquake of interest.<br />
The GMI parameter is useful for sites in <strong>Oregon</strong> where the seismic hazard reflects contributions<br />
from both large subduction earthquakes and moderate, near-surface crustal events. The GMI<br />
value provides a simplified “weighting” factor that demonstrates the effect of ground motion<br />
duration on permanent embankment deformations.<br />
132