- Page 1:
ASSESSMENT AND MITIGATION OF LIQUEF
- Page 5 and 6:
ACKNOWLEDGMENTS The authors would l
- Page 7 and 8:
ASSESSMENT AND MITIGATION OF LIQUEF
- Page 9 and 10:
8.0 HAZARD EVALUATION AND DEVELOPME
- Page 11 and 12:
LIST OF FIGURES Figure 1.1: ODOT’
- Page 13:
Figure 8.8: Long Valley Dam and Lak
- Page 16 and 17:
Design of a given component shall l
- Page 18 and 19:
Liquefaction Mitigation Procedure G
- Page 20 and 21:
Pacific Northwest also are summariz
- Page 23 and 24:
2.0 OVERVIEW OF LIQUEFACTION-INDUCE
- Page 25 and 26:
oughly 50 centimeters, with numerou
- Page 27 and 28:
supported bridges along the Seward
- Page 29 and 30:
Another area of extensive bridge da
- Page 31 and 32:
Nineteen bridges were also damaged
- Page 33 and 34:
1. No foundation failures were obse
- Page 35 and 36:
piles supporting the fourth pier, l
- Page 37 and 38:
Figure 2.17: Observed Pile Deformat
- Page 39 and 40:
Figure 2.19: Damage from the 1906 S
- Page 41 and 42:
Figure 2.22: Ground Deformations Ne
- Page 43 and 44: induced ground displacement was the
- Page 45 and 46: Well-documented case histories of t
- Page 47 and 48: Similar damage to pile foundations
- Page 49 and 50: Examples of acceptable bridge found
- Page 51 and 52: Numerous investigations of liquefac
- Page 53 and 54: 3.0 EVALUATION OF LIQUEFACTION SUSC
- Page 55 and 56: The evaluation of liquefaction haza
- Page 57 and 58: Table 3.1: Estimated Susceptibility
- Page 59 and 60: movements, or localized ground disp
- Page 61 and 62: Shear wave velocities can now be ob
- Page 63 and 64: 3.4 LIQUEFACTION RESISTANCE: EMPIRI
- Page 65 and 66: Figure 3.1: Range of r d Values for
- Page 67 and 68: The earthquake-induced shearing str
- Page 69 and 70: drill rod during hammer impact. In
- Page 71 and 72: Figure 3.5: Minimum Values for K σ
- Page 73 and 74: 3.4.2.2.1 CPT Method Developed by R
- Page 75 and 76: 1. Sensitive, fine grained 6. Sands
- Page 77 and 78: Figure 3.9: CPT-Based Curves for Va
- Page 79 and 80: CRR where: q c 2 3 0.00128 0.0
- Page 81 and 82: Tacoma, Washington (Dickenson and B
- Page 83 and 84: Table 3.8: Influence of OCR on the
- Page 85 and 86: Figure 3.13: Influence of Fines Con
- Page 87: Gravel Sand Figure 3.16: Relationsh
- Page 90 and 91: FS L > 1.4: Excess pore pressure ge
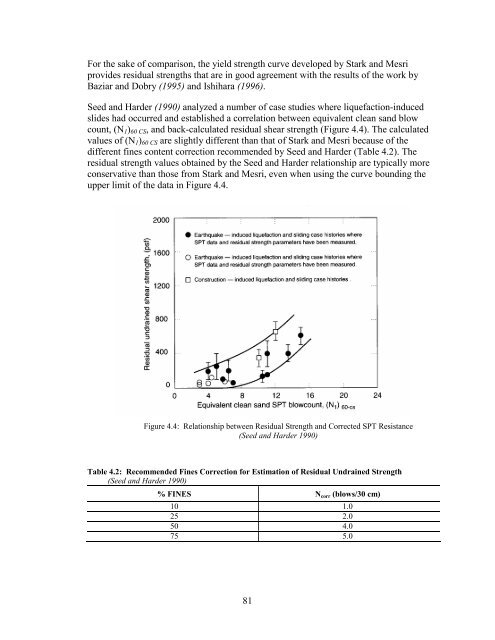
- Page 92 and 93: The post-liquefaction strength of s
- Page 96 and 97: 4.3 INTRODUCTION TO MODES OF FAILUR
- Page 98 and 99: Figure 4.5: (a) Relationship betwee
- Page 100 and 101: not available for many case studies
- Page 102 and 103: provided to give the recommended ra
- Page 104 and 105: Figure 4.8: Overview of EPOLLS Mode
- Page 106 and 107: Figure 4.10: Model of Hypothetical
- Page 108 and 109: 4.5.2 Advanced Numerical Modeling o
- Page 110 and 111: Figure 4.12: Post Volumetric Shear
- Page 112 and 113: The relationship shown in Figure 4.
- Page 114 and 115: A third type of failure is shown in
- Page 116 and 117: Table 5.1: Liquefaction Remediation
- Page 118 and 119: 5.3 DESIGN OF SOIL MITIGATION The d
- Page 120 and 121: soil improvement guidelines state t
- Page 122 and 123: The models were instrumented with a
- Page 124 and 125: The model uses an explicit method,
- Page 126 and 127: A simplification was made in the mo
- Page 128 and 129: permanent earthquake displacements)
- Page 130 and 131: 7.0 DEFORMATION ANALYSIS OF EMBANKM
- Page 132 and 133: engineers; (2) requisite input incl
- Page 134 and 135: π g 2 a t I a 2 dt (7-1) The A
- Page 136 and 137: 10 1 Bracketed Intensity (m/s) 0.1
- Page 138 and 139: 7.3 PARAMETRIC STUDY A well-validat
- Page 140 and 141: the rigid body methods. The point a
- Page 142 and 143: 0.4 Acceleration (g) 0.2 0 -0.2 -0.
- Page 144 and 145:
Embankment Height (m) Depth of Liqu
- Page 146 and 147:
10 1 DISPLACEMENT (m) 0.1 Morgan Hi
- Page 148 and 149:
2.0 Embankment Toe Embankment Mid-S
- Page 150:
suitably reliable estimates of perm
- Page 153 and 154:
interest. Specifically, the peak be
- Page 155 and 156:
Flow Chart for Evaluation and Mitig
- Page 157 and 158:
The deformation evaluations were pe
- Page 159 and 160:
Portland (a) (b) Figure 8.2: Illust
- Page 161 and 162:
Figure 8.4: Contours of PGA on Rock
- Page 163 and 164:
Borehole 4E CPT Hole 4E 26.0' NGVD
- Page 165 and 166:
8.4.2 Subduction Zone Bedrock Motio
- Page 167 and 168:
154 Table 8.5: Selected Acceleratio
- Page 169 and 170:
Spectral Acceleration (g) 1.50 1.40
- Page 171 and 172:
with the calculated equivalent unif
- Page 173 and 174:
n ( M 10 1) (8-1) where M is the
- Page 175 and 176:
0.20 0.15 0.10 Acceleration (g) 0.0
- Page 177 and 178:
15.0 12.5 10.0 Long Valley Dam Lake
- Page 179 and 180:
CSR should be modified for the pres
- Page 181 and 182:
8.7 EVALUATION OF INITIATION OF LIQ
- Page 183 and 184:
crest stage Marine Drive 42.5 ft NG
- Page 185 and 186:
Table 8.9: Fines Content Values Est
- Page 187 and 188:
large sliding and long-term disrupt
- Page 189 and 190:
Table 8.12: Deformation Results fro
- Page 191 and 192:
The earthquake time histories used
- Page 193 and 194:
North (river) South (land) North To
- Page 195 and 196:
Table 8.20: Riverward Deformation R
- Page 197 and 198:
applications (DDC, closely spaced v
- Page 199 and 200:
Table 8.21: Comparison of Predicted
- Page 202 and 203:
9.0 SUMMARY AND CONCLUSIONS Recent
- Page 204:
dewatering may be warranted. Additi
- Page 207 and 208:
Bardet, J.P. (1990). “LINOS - A N
- Page 209 and 210:
California Division of Mines and Ge
- Page 211 and 212:
Fujii, S., M. Cubrinovski, K. Tokim
- Page 213 and 214:
Ishihara, K. and M. Cubrinovski. (1
- Page 215 and 216:
Liu, A.H. and J.P. Stewart. (1999).
- Page 217 and 218:
Oregon Department of Transportation
- Page 219 and 220:
Schnabel, P., J. Lysmer, and H.B. S
- Page 221 and 222:
Sun, I.H. and I.M. Idriss. (1992).
- Page 223:
Youd, T.L. and C.F. Jones. (1993).