Report - Oregon State Library: State Employee Information Center ...
Report - Oregon State Library: State Employee Information Center ...
Report - Oregon State Library: State Employee Information Center ...

You also want an ePaper? Increase the reach of your titles
YUMPU automatically turns print PDFs into web optimized ePapers that Google loves.
conservatively estimated in subsequent analyses to be normally consolidated based on the<br />
results of the consolidation tests, and the DMT and CPT data reduction. In order to<br />
estimate the CRR values for the silts from the laboratory data, the number of uniform<br />
loading cycles anticipated for each design-level earthquake is required. Recent data<br />
relating the number of uniform cycles to earthquake magnitude was utilized (Liu and<br />
Stewart 1999) and are shown in Figure 3.15. It should be noted that the curves were<br />
extrapolated for magnitudes greater than seven. Given the cyclic resistance curves<br />
(Figure 3.11) and the number of uniform loading cycles for the scenario earthquakes<br />
(Figure 3.15), the CRR can be estimated. Table 8.7 shows the equivalent number of<br />
cycles and corrected CRR values for the ML soils for the design-level earthquakes.<br />
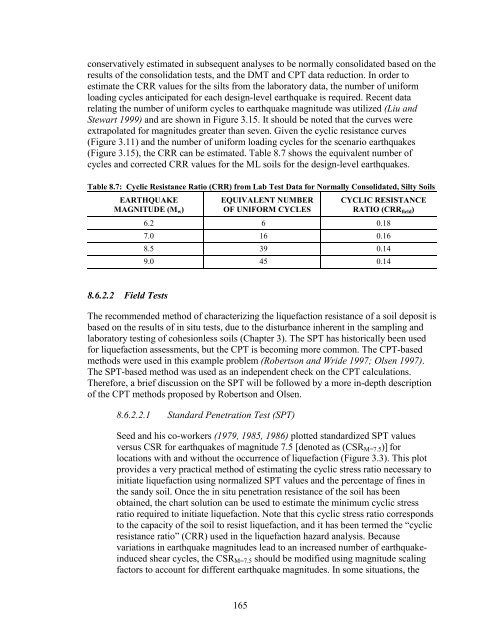
Table 8.7: Cyclic Resistance Ratio (CRR) from Lab Test Data for Normally Consolidated, Silty Soils<br />
EARTHQUAKE<br />
MAGNITUDE (M w )<br />
EQUIVALENT NUMBER<br />
OF UNIFORM CYCLES<br />
CYCLIC RESISTANCE<br />
RATIO (CRR field )<br />
6.2 6 0.18<br />
7.0 16 0.16<br />
8.5 39 0.14<br />
9.0 45 0.14<br />
8.6.2.2 Field Tests<br />
The recommended method of characterizing the liquefaction resistance of a soil deposit is<br />
based on the results of in situ tests, due to the disturbance inherent in the sampling and<br />
laboratory testing of cohesionless soils (Chapter 3). The SPT has historically been used<br />
for liquefaction assessments, but the CPT is becoming more common. The CPT-based<br />
methods were used in this example problem (Robertson and Wride 1997; Olsen 1997).<br />
The SPT-based method was used as an independent check on the CPT calculations.<br />
Therefore, a brief discussion on the SPT will be followed by a more in-depth description<br />
of the CPT methods proposed by Robertson and Olsen.<br />
8.6.2.2.1 Standard Penetration Test (SPT)<br />
Seed and his co-workers (1979, 1985, 1986) plotted standardized SPT values<br />
versus CSR for earthquakes of magnitude 7.5 [denoted as (CSR M=7.5 )] for<br />
locations with and without the occurrence of liquefaction (Figure 3.3). This plot<br />
provides a very practical method of estimating the cyclic stress ratio necessary to<br />
initiate liquefaction using normalized SPT values and the percentage of fines in<br />
the sandy soil. Once the in situ penetration resistance of the soil has been<br />
obtained, the chart solution can be used to estimate the minimum cyclic stress<br />
ratio required to initiate liquefaction. Note that this cyclic stress ratio corresponds<br />
to the capacity of the soil to resist liquefaction, and it has been termed the “cyclic<br />
resistance ratio” (CRR) used in the liquefaction hazard analysis. Because<br />
variations in earthquake magnitudes lead to an increased number of earthquakeinduced<br />
shear cycles, the CSR M=7.5 should be modified using magnitude scaling<br />
factors to account for different earthquake magnitudes. In some situations, the<br />
165