Report - Oregon State Library: State Employee Information Center ...
Report - Oregon State Library: State Employee Information Center ...
Report - Oregon State Library: State Employee Information Center ...
Create successful ePaper yourself
Turn your PDF publications into a flip-book with our unique Google optimized e-Paper software.
CSR should be modified for the presence of large overburden pressures and for<br />
static shear stresses; however, these concerns were not used in the levee analyses<br />
consistent with the recommendations contained in Youd and Idriss (1997).<br />
Therefore, the CSR can be calculated with the following equation:<br />
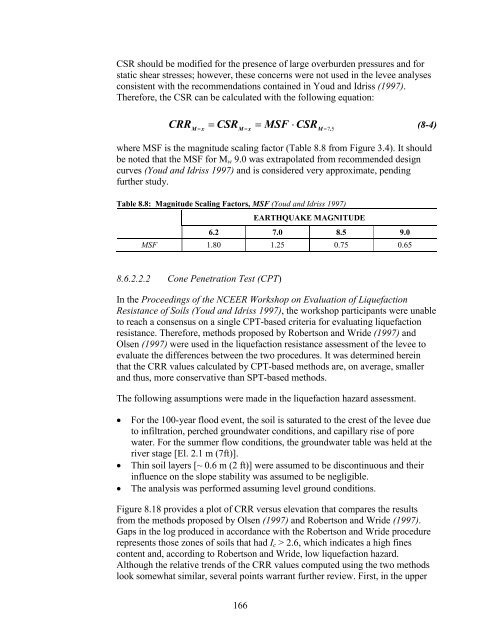
CRR<br />
M x<br />
CSR<br />
M x<br />
MSF<br />
CSR<br />
M 7.5<br />
(8-4)<br />
where MSF is the magnitude scaling factor (Table 8.8 from Figure 3.4). It should<br />
be noted that the MSF for M w 9.0 was extrapolated from recommended design<br />
curves (Youd and Idriss 1997) and is considered very approximate, pending<br />
further study.<br />
Table 8.8: Magnitude Scaling Factors, MSF (Youd and Idriss 1997)<br />
EARTHQUAKE MAGNITUDE<br />
6.2 7.0 8.5 9.0<br />
MSF 1.80 1.25 0.75 0.65<br />
8.6.2.2.2 Cone Penetration Test (CPT)<br />
In the Proceedings of the NCEER Workshop on Evaluation of Liquefaction<br />
Resistance of Soils (Youd and Idriss 1997), the workshop participants were unable<br />
to reach a consensus on a single CPT-based criteria for evaluating liquefaction<br />
resistance. Therefore, methods proposed by Robertson and Wride (1997) and<br />
Olsen (1997) were used in the liquefaction resistance assessment of the levee to<br />
evaluate the differences between the two procedures. It was determined herein<br />
that the CRR values calculated by CPT-based methods are, on average, smaller<br />
and thus, more conservative than SPT-based methods.<br />
The following assumptions were made in the liquefaction hazard assessment.<br />
<br />
<br />
<br />
For the 100-year flood event, the soil is saturated to the crest of the levee due<br />
to infiltration, perched groundwater conditions, and capillary rise of pore<br />
water. For the summer flow conditions, the groundwater table was held at the<br />
river stage [El. 2.1 m (7ft)].<br />
Thin soil layers [~ 0.6 m (2 ft)] were assumed to be discontinuous and their<br />
influence on the slope stability was assumed to be negligible.<br />
The analysis was performed assuming level ground conditions.<br />
Figure 8.18 provides a plot of CRR versus elevation that compares the results<br />
from the methods proposed by Olsen (1997) and Robertson and Wride (1997).<br />
Gaps in the log produced in accordance with the Robertson and Wride procedure<br />
represents those zones of soils that had I c > 2.6, which indicates a high fines<br />
content and, according to Robertson and Wride, low liquefaction hazard.<br />
Although the relative trends of the CRR values computed using the two methods<br />
look somewhat similar, several points warrant further review. First, in the upper<br />
166


