Report - Oregon State Library: State Employee Information Center ...
Report - Oregon State Library: State Employee Information Center ...
Report - Oregon State Library: State Employee Information Center ...

Create successful ePaper yourself
Turn your PDF publications into a flip-book with our unique Google optimized e-Paper software.
The earthquake time histories used in the analyses were recorded during the M w 6.2 Mammoth<br />
Lakes earthquake (Long Valley Dam station) and M w 8.5 Michoacán earthquake (Aeropuerto<br />
station). The motions were scaled to 0.29g and 0.12g, respectively. The SHAKE91 program was<br />
used to generate time histories at elevation -18 m (the input location for the motions in FLAC).<br />
The damping of the earthquake motions for numerical stability utilized Rayleigh damping. The<br />
acceptable Rayleigh damping used in the models was determined from the validation studies to<br />
be 5% at 5 Hz. Any baseline drift in the earthquake motions has been removed from all of the<br />
presented FLAC displacements.<br />
The ground motions computed with FLAC for the embankment and foundation soils (elevations<br />
1.5m and 6.4m as previously referenced) differ from those computed using the SHAKE91<br />
program for two primary reasons. First, the FLAC model employs a linear analysis for dynamic<br />
ground response while the SHAKE91 model is based on the equivalent linear approach. In<br />
addition, the FLAC program models the embankment in two dimensions as opposed to the 1D<br />
model used in SHAKE91. The end result of these important differences is that the ground<br />
motions computed with FLAC are greater than those computed with SHAKE91. FLAC motions<br />
at selected elevations in the model were as large as 50% to 90% greater than the values produced<br />
with SHAKE91. Effects such as 2D embankment response highlight the need to adjust results<br />
from 1D models with the results of case history data, 2D and 3D response analyses of similar<br />
earth structures, and sound engineering judgment.<br />
The water within the soil was modeled directly and was allowed to flow during the static<br />
solutions. During the dynamic solutions excess pore pressures were allowed to generate, but the<br />
dissipation of these pore pressures during earthquake shaking was not modeled. Water outside<br />
the slope was modeled as boundary pore pressure; therefore hydrodynamic effects were not<br />
modeled.<br />
The boundary conditions for the static solutions consisted of the bottom boundary being fixed in<br />
both the horizontal and vertical directions, while the sides of the model were treated as rollers<br />
(by fixing only the horizontal direction). During the dynamic analysis the bottom boundary was<br />
freed in the horizontal direction to allow application of the horizontal acceleration, and the<br />
sidewalls were treated as an infinite medium (free field), having the same properties as the<br />
adjacent model perimeter zones. Figure 8.22 shows the soil layering and the model grid used in<br />
the numerical model analyses. The soil properties used in the numerical model for the layers<br />
shown in the figure are given in Table 8.16.<br />
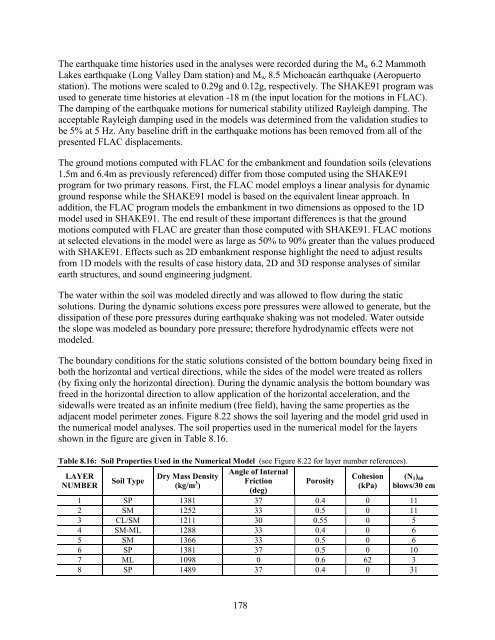
Table 8.16: Soil Properties Used in the Numerical Model (see Figure 8.22 for layer number references).<br />
Angle of Internal<br />
LAYER<br />
Dry Mass Density<br />
Cohesion (N<br />
Soil Type<br />
NUMBER<br />
(kg/m 3 Friction Porosity<br />
1 ) 60<br />
)<br />
(kPa) blows/30 cm<br />
(deg)<br />
1 SP 1381 37 0.4 0 11<br />
2 SM 1252 33 0.5 0 11<br />
3 CL/SM 1211 30 0.55 0 5<br />
4 SM-ML 1288 33 0.4 0 6<br />
5 SM 1366 33 0.5 0 6<br />
6 SP 1381 37 0.5 0 10<br />
7 ML 1098 0 0.6 62 3<br />
8 SP 1489 37 0.4 0 31<br />
178