Report - Oregon State Library: State Employee Information Center ...
Report - Oregon State Library: State Employee Information Center ...
Report - Oregon State Library: State Employee Information Center ...
Create successful ePaper yourself
Turn your PDF publications into a flip-book with our unique Google optimized e-Paper software.
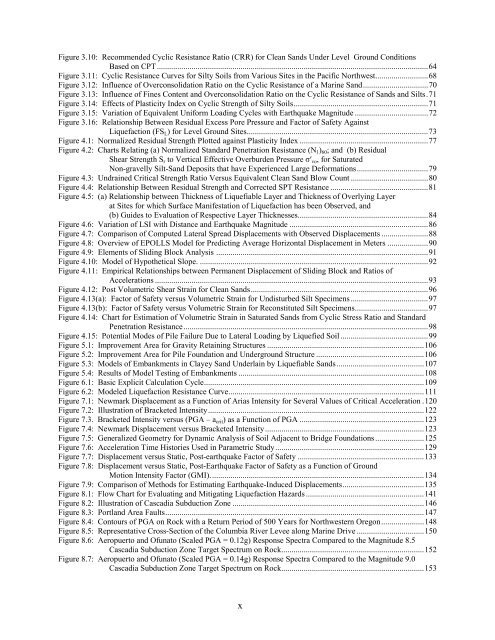
Figure 3.10: Recommended Cyclic Resistance Ratio (CRR) for Clean Sands Under Level Ground Conditions<br />
Based on CPT.....................................................................................................................................64<br />
Figure 3.11: Cyclic Resistance Curves for Silty Soils from Various Sites in the Pacific Northwest..........................68<br />
Figure 3.12: Influence of Overconsolidation Ratio on the Cyclic Resistance of a Marine Sand................................70<br />
Figure 3.13: Influence of Fines Content and Overconsolidation Ratio on the Cyclic Resistance of Sands and Silts.71<br />
Figure 3.14: Effects of Plasticity Index on Cyclic Strength of Silty Soils..................................................................71<br />
Figure 3.15: Variation of Equivalent Uniform Loading Cycles with Earthquake Magnitude ....................................72<br />
Figure 3.16: Relationship Between Residual Excess Pore Pressure and Factor of Safety Against<br />
Liquefaction (FS L ) for Level Ground Sites.........................................................................................73<br />
Figure 4.1: Normalized Residual Strength Plotted against Plasticity Index ...............................................................77<br />
Figure 4.2: Charts Relating (a) Normalized Standard Penetration Resistance (N 1 ) 60 ; and (b) Residual<br />
Shear Strength S r to Vertical Effective Overburden Pressure σ′ vo , for Saturated<br />
Non-gravelly Silt-Sand Deposits that have Experienced Large Deformations...................................79<br />
Figure 4.3: Undrained Critical Strength Ratio Versus Equivalent Clean Sand Blow Count ......................................80<br />
Figure 4.4: Relationship Between Residual Strength and Corrected SPT Resistance ................................................81<br />
Figure 4.5: (a) Relationship between Thickness of Liquefiable Layer and Thickness of Overlying Layer<br />
at Sites for which Surface Manifestation of Liquefaction has been Observed, and<br />
(b) Guides to Evaluation of Respective Layer Thicknesses................................................................84<br />
Figure 4.6: Variation of LSI with Distance and Earthquake Magnitude ....................................................................86<br />
Figure 4.7: Comparison of Computed Lateral Spread Displacements with Observed Displacements .......................88<br />
Figure 4.8: Overview of EPOLLS Model for Predicting Average Horizontal Displacement in Meters ....................90<br />
Figure 4.9: Elements of Sliding Block Analysis ........................................................................................................91<br />
Figure 4.10: Model of Hypothetical Slope. ................................................................................................................92<br />
Figure 4.11: Empirical Relationships between Permanent Displacement of Sliding Block and Ratios of<br />
Accelerations ......................................................................................................................................93<br />
Figure 4.12: Post Volumetric Shear Strain for Clean Sands.......................................................................................96<br />
Figure 4.13(a): Factor of Safety versus Volumetric Strain for Undisturbed Silt Specimens ......................................97<br />
Figure 4.13(b): Factor of Safety versus Volumetric Strain for Reconstituted Silt Specimens....................................97<br />
Figure 4.14: Chart for Estimation of Volumetric Strain in Saturated Sands from Cyclic Stress Ratio and Standard<br />
Penetration Resistance........................................................................................................................98<br />
Figure 4.15: Potential Modes of Pile Failure Due to Lateral Loading by Liquefied Soil ...........................................99<br />
Figure 5.1: Improvement Area for Gravity Retaining Structures .............................................................................106<br />
Figure 5.2: Improvement Area for Pile Foundation and Underground Structure .....................................................106<br />
Figure 5.3: Models of Embankments in Clayey Sand Underlain by Liquefiable Sands...........................................107<br />
Figure 5.4: Results of Model Testing of Embankments ...........................................................................................108<br />
Figure 6.1: Basic Explicit Calculation Cycle............................................................................................................109<br />
Figure 6.2: Modeled Liquefaction Resistance Curve................................................................................................111<br />
Figure 7.1: Newmark Displacement as a Function of Arias Intensity for Several Values of Critical Acceleration .120<br />
Figure 7.2: Illustration of Bracketed Intensity..........................................................................................................122<br />
Figure 7.3. Bracketed Intensity versus (PGA – a crit ) as a Function of PGA .............................................................123<br />
Figure 7.4: Newmark Displacement versus Bracketed Intensity..............................................................................123<br />
Figure 7.5: Generalized Geometry for Dynamic Analysis of Soil Adjacent to Bridge Foundations ........................125<br />
Figure 7.6: Acceleration Time Histories Used in Parametric Study.........................................................................129<br />
Figure 7.7: Displacement versus Static, Post-earthquake Factor of Safety ..............................................................133<br />
Figure 7.8: Displacement versus Static, Post-Earthquake Factor of Safety as a Function of Ground<br />
Motion Intensity Factor (GMI).........................................................................................................134<br />
Figure 7.9: Comparison of Methods for Estimating Earthquake-Induced Displacements........................................135<br />
Figure 8.1: Flow Chart for Evaluating and Mitigating Liquefaction Hazards ..........................................................141<br />
Figure 8.2: Illustration of Cascadia Subduction Zone ..............................................................................................146<br />
Figure 8.3: Portland Area Faults...............................................................................................................................147<br />
Figure 8.4: Contours of PGA on Rock with a Return Period of 500 Years for Northwestern <strong>Oregon</strong>.....................148<br />
Figure 8.5: Representative Cross-Section of the Columbia River Levee along Marine Drive .................................150<br />
Figure 8.6: Aeropuerto and Ofunato (Scaled PGA = 0.12g) Response Spectra Compared to the Magnitude 8.5<br />
Cascadia Subduction Zone Target Spectrum on Rock......................................................................152<br />
Figure 8.7: Aeropuerto and Ofunato (Scaled PGA = 0.14g) Response Spectra Compared to the Magnitude 9.0<br />
Cascadia Subduction Zone Target Spectrum on Rock......................................................................153<br />
x


