Report - Oregon State Library: State Employee Information Center ...
Report - Oregon State Library: State Employee Information Center ...
Report - Oregon State Library: State Employee Information Center ...
Create successful ePaper yourself
Turn your PDF publications into a flip-book with our unique Google optimized e-Paper software.
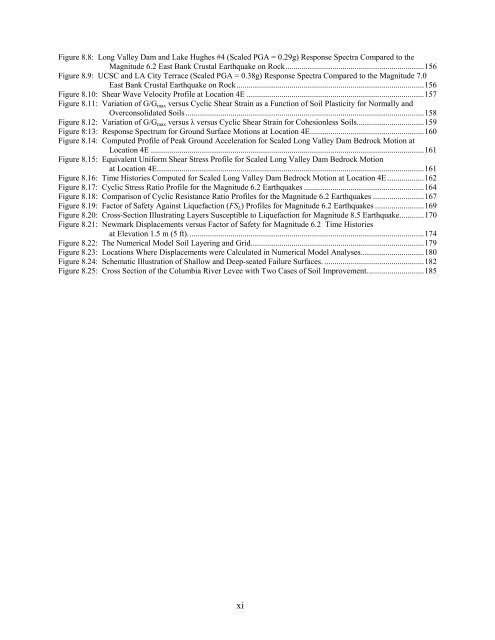
Figure 8.8: Long Valley Dam and Lake Hughes #4 (Scaled PGA = 0.29g) Response Spectra Compared to the<br />
Magnitude 6.2 East Bank Crustal Earthquake on Rock....................................................................156<br />
Figure 8.9: UCSC and LA City Terrace (Scaled PGA = 0.38g) Response Spectra Compared to the Magnitude 7.0<br />
East Bank Crustal Earthquake on Rock............................................................................................156<br />
Figure 8.10: Shear Wave Velocity Profile at Location 4E .......................................................................................157<br />
Figure 8.11: Variation of G/G max versus Cyclic Shear Strain as a Function of Soil Plasticity for Normally and<br />
Overconsolidated Soils .....................................................................................................................158<br />
Figure 8.12: Variation of G/G max versus λ versus Cyclic Shear Strain for Cohesionless Soils.................................159<br />
Figure 8:13: Response Spectrum for Ground Surface Motions at Location 4E........................................................160<br />
Figure 8.14: Computed Profile of Peak Ground Acceleration for Scaled Long Valley Dam Bedrock Motion at<br />
Location 4E ......................................................................................................................................161<br />
Figure 8.15: Equivalent Uniform Shear Stress Profile for Scaled Long Valley Dam Bedrock Motion<br />
at Location 4E...................................................................................................................................161<br />
Figure 8.16: Time Histories Computed for Scaled Long Valley Dam Bedrock Motion at Location 4E..................162<br />
Figure 8.17: Cyclic Stress Ratio Profile for the Magnitude 6.2 Earthquakes ...........................................................164<br />
Figure 8.18: Comparison of Cyclic Resistance Ratio Profiles for the Magnitude 6.2 Earthquakes .........................167<br />
Figure 8.19: Factor of Safety Against Liquefaction (FS L ) Profiles for Magnitude 6.2 Earthquakes ........................169<br />
Figure 8.20: Cross-Section Illustrating Layers Susceptible to Liquefaction for Magnitude 8.5 Earthquake............170<br />
Figure 8.21: Newmark Displacements versus Factor of Safety for Magnitude 6.2 Time Histories<br />
at Elevation 1.5 m (5 ft)....................................................................................................................174<br />
Figure 8.22: The Numerical Model Soil Layering and Grid.....................................................................................179<br />
Figure 8.23: Locations Where Displacements were Calculated in Numerical Model Analyses...............................180<br />
Figure 8.24: Schematic Illustration of Shallow and Deep-seated Failure Surfaces. .................................................182<br />
Figure 8.25: Cross Section of the Columbia River Levee with Two Cases of Soil Improvement............................185<br />
xi


