

Three Essays on Executive Compensation - KOPS - Universität ...
Three Essays on Executive Compensation - KOPS - Universität ...
Three Essays on Executive Compensation - KOPS - Universität ...

Create successful ePaper yourself
Turn your PDF publications into a flip-book with our unique Google optimized e-Paper software.
Which Pay for what Performance? Evidence from <strong>Executive</strong><br />
Compensati<strong>on</strong> in Germany and the United States<br />
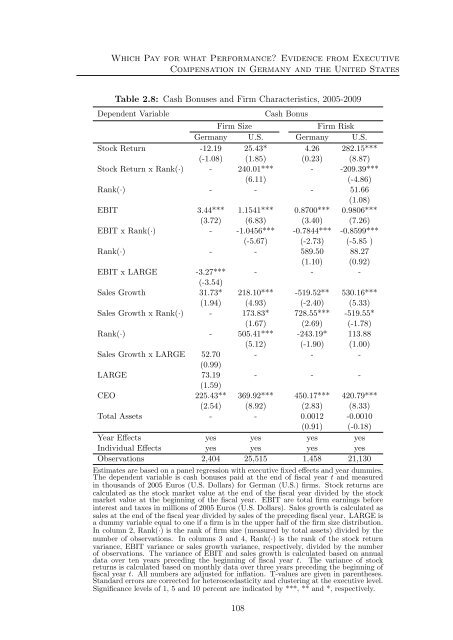
Table 2.8: Cash B<strong>on</strong>uses and Firm Characteristics, 2005-2009<br />
Dependent Variable<br />
Cash B<strong>on</strong>us<br />
Firm Size<br />
Firm Risk<br />
Germany U.S. Germany U.S.<br />
Stock Return -12.19 25.43* 4.26 282.15***<br />
(-1.08) (1.85) (0.23) (8.87)<br />
Stock Return x Rank(·) - 240.01*** - -209.39***<br />
(6.11) (-4.86)<br />
Rank(·) - - - 51.66<br />
(1.08)<br />
EBIT 3.44*** 1.1541*** 0.8700*** 0.9806***<br />
(3.72) (6.83) (3.40) (7.26)<br />
EBIT x Rank(·) - -1.0456*** -0.7844*** -0.8599***<br />
(-5.67) (-2.73) (-5.85 )<br />
Rank(·) - - 589.50 88.27<br />
(1.10) (0.92)<br />
EBIT x LARGE -3.27*** - - -<br />
(-3.54)<br />
Sales Growth 31.73* 218.10*** -519.52** 530.16***<br />
(1.94) (4.93) (-2.40) (5.33)<br />
Sales Growth x Rank(·) - 173.83* 728.55*** -519.55*<br />
(1.67) (2.69) (-1.78)<br />
Rank(·) - 505.41*** -243.19* 113.88<br />
(5.12) (-1.90) (1.00)<br />
Sales Growth x LARGE 52.70 - - -<br />
(0.99)<br />
LARGE 73.19 - - -<br />
(1.59)<br />
CEO 225.43** 369.92*** 450.17*** 420.79***<br />
(2.54) (8.92) (2.83) (8.33)<br />
Total Assets - - 0.0012 -0.0010<br />
(0.91) (-0.18)<br />
Year Effects yes yes yes yes<br />
Individual Effects yes yes yes yes<br />
Observati<strong>on</strong>s 2,404 25,515 1,458 21,130<br />
Estimates are based <strong>on</strong> a panel regressi<strong>on</strong> with executive fixed effects and year dummies.<br />
The dependent variable is cash b<strong>on</strong>uses paid at the end of fiscal year t and measured<br />
in thousands of 2005 Euros (U.S. Dollars) for German (U.S.) firms. Stock returns are<br />
calculated as the stock market value at the end of the fiscal year divided by the stock<br />
market value at the beginning of the fiscal year. EBIT are total firm earnings before<br />
interest and taxes in milli<strong>on</strong>s of 2005 Euros (U.S. Dollars). Sales growth is calculated as<br />
sales at the end of the fiscal year divided by sales of the preceding fiscal year. LARGE is<br />
a dummy variable equal to <strong>on</strong>e if a firm is in the upper half of the firm size distributi<strong>on</strong>.<br />
In column 2, Rank(·) is the rank of firm size (measured by total assets) divided by the<br />
number of observati<strong>on</strong>s. In columns 3 and 4, Rank(·) is the rank of the stock return<br />
variance, EBIT variance or sales growth variance, respectively, divided by the number<br />
of observati<strong>on</strong>s. The variance of EBIT and sales growth is calculated based <strong>on</strong> annual<br />
data over ten years preceding the beginning of fiscal year t. The variance of stock<br />
returns is calculated based <strong>on</strong> m<strong>on</strong>thly data over three years preceding the beginning of<br />
fiscal year t. All numbers are adjusted for inflati<strong>on</strong>. T-values are given in parentheses.<br />
Standard errors are corrected for heteroscedasticity and clustering at the executive level.<br />
Significance levels of 1, 5 and 10 percent are indicated by ***, ** and *, respectively.<br />
108


