

Three Essays on Executive Compensation - KOPS - Universität ...
Three Essays on Executive Compensation - KOPS - Universität ...
Three Essays on Executive Compensation - KOPS - Universität ...

You also want an ePaper? Increase the reach of your titles
YUMPU automatically turns print PDFs into web optimized ePapers that Google loves.
Which Pay for what Performance? Evidence from <strong>Executive</strong><br />
Compensati<strong>on</strong> in Germany and the United States<br />
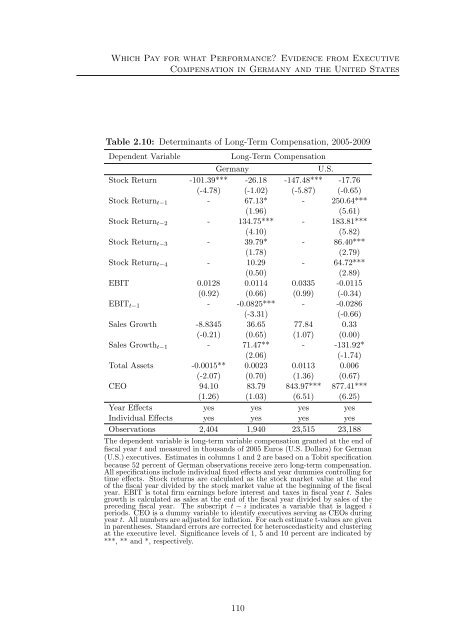
Table 2.10: Determinants of L<strong>on</strong>g-Term Compensati<strong>on</strong>, 2005-2009<br />
Dependent Variable<br />
L<strong>on</strong>g-Term Compensati<strong>on</strong><br />
Germany<br />
U.S.<br />
Stock Return -101.39*** -26.18 -147.48*** -17.76<br />
(-4.78) (-1.02) (-5.87) (-0.65)<br />
Stock Return t−1 - 67.13* - 250.64***<br />
(1.96) (5.61)<br />
Stock Return t−2 - 134.75*** - 183.81***<br />
(4.10) (5.82)<br />
Stock Return t−3 - 39.79* - 86.40***<br />
(1.78) (2.79)<br />
Stock Return t−4 - 10.29 - 64.72***<br />
(0.50) (2.89)<br />
EBIT 0.0128 0.0114 0.0335 -0.0115<br />
(0.92) (0.66) (0.99) (-0.34)<br />
EBIT t−1 - -0.0825*** - -0.0286<br />
(-3.31) (-0.66)<br />
Sales Growth -8.8345 36.65 77.84 0.33<br />
(-0.21) (0.65) (1.07) (0.00)<br />
Sales Growth t−1 - 71.47** - -131.92*<br />
(2.06) (-1.74)<br />
Total Assets -0.0015** 0.0023 0.0113 0.006<br />
(-2.07) (0.70) (1.36) (0.67)<br />
CEO 94.10 83.79 843.97*** 877.41***<br />
(1.26) (1.03) (6.51) (6.25)<br />
Year Effects yes yes yes yes<br />
Individual Effects yes yes yes yes<br />
Observati<strong>on</strong>s 2,404 1,940 23,515 23,188<br />
The dependent variable is l<strong>on</strong>g-term variable compensati<strong>on</strong> granted at the end of<br />
fiscal year t and measured in thousands of 2005 Euros (U.S. Dollars) for German<br />
(U.S.) executives. Estimates in columns 1 and 2 are based <strong>on</strong> a Tobit specificati<strong>on</strong><br />
because 52 percent of German observati<strong>on</strong>s receive zero l<strong>on</strong>g-term compensati<strong>on</strong>.<br />
All specificati<strong>on</strong>s include individual fixed effects and year dummies c<strong>on</strong>trolling for<br />
time effects. Stock returns are calculated as the stock market value at the end<br />
of the fiscal year divided by the stock market value at the beginning of the fiscal<br />
year. EBIT is total firm earnings before interest and taxes in fiscal year t. Sales<br />
growth is calculated as sales at the end of the fiscal year divided by sales of the<br />
preceding fiscal year. The subscript t − i indicates a variable that is lagged i<br />
periods. CEO is a dummy variable to identify executives serving as CEOs during<br />
year t. All numbers are adjusted for inflati<strong>on</strong>. For each estimate t-values are given<br />
in parentheses. Standard errors are corrected for heteroscedasticity and clustering<br />
at the executive level. Significance levels of 1, 5 and 10 percent are indicated by<br />
***, ** and *, respectively.<br />
110


