

Three Essays on Executive Compensation - KOPS - Universität ...
Three Essays on Executive Compensation - KOPS - Universität ...
Three Essays on Executive Compensation - KOPS - Universität ...

Create successful ePaper yourself
Turn your PDF publications into a flip-book with our unique Google optimized e-Paper software.
Profit Sharing with <strong>Executive</strong>s<br />
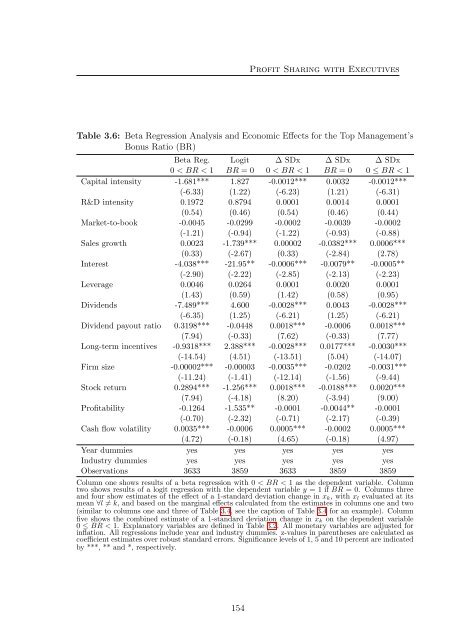
Table 3.6: Beta Regressi<strong>on</strong> Analysis and Ec<strong>on</strong>omic Effects for the Top Management’s<br />
B<strong>on</strong>us Ratio (BR)<br />
Beta Reg. Logit ∆ SDx ∆ SDx ∆ SDx<br />
0 < BR < 1 BR = 0 0 < BR < 1 BR = 0 0 ≤ BR < 1<br />
Capital intensity -1.681*** 1.827 -0.0012*** 0.0032 -0.0012***<br />
(-6.33) (1.22) (-6.23) (1.21) (-6.31)<br />
R&D intensity 0.1972 0.8794 0.0001 0.0014 0.0001<br />
(0.54) (0.46) (0.54) (0.46) (0.44)<br />
Market-to-book -0.0045 -0.0299 -0.0002 -0.0039 -0.0002<br />
(-1.21) (-0.94) (-1.22) (-0.93) (-0.88)<br />
Sales growth 0.0023 -1.739*** 0.00002 -0.0382*** 0.0006***<br />
(0.33) (-2.67) (0.33) (-2.84) (2.78)<br />
Interest -4.038*** -21.95** -0.0006*** -0.0079** -0.0005**<br />
(-2.90) (-2.22) (-2.85) (-2.13) (-2.23)<br />
Leverage 0.0046 0.0264 0.0001 0.0020 0.0001<br />
(1.43) (0.59) (1.42) (0.58) (0.95)<br />
Dividends -7.489*** 4.600 -0.0028*** 0.0043 -0.0028***<br />
(-6.35) (1.25) (-6.21) (1.25) (-6.21)<br />
Dividend payout ratio 0.3198*** -0.0448 0.0018*** -0.0006 0.0018***<br />
(7.94) (-0.33) (7.62) (-0.33) (7.77)<br />
L<strong>on</strong>g-term incentives -0.9318*** 2.388*** -0.0028*** 0.0177*** -0.0030***<br />
(-14.54) (4.51) (-13.51) (5.04) (-14.07)<br />
Firm size -0.00002*** -0.00003 -0.0035*** -0.0202 -0.0031***<br />
(-11.24) (-1.41) (-12.14) (-1.56) (-9.44)<br />
Stock return 0.2894*** -1.256*** 0.0018*** -0.0188*** 0.0020***<br />
(7.94) (-4.18) (8.20) (-3.94) (9.00)<br />
Profitability -0.1264 -1.535** -0.0001 -0.0044** -0.0001<br />
(-0.70) (-2.32) (-0.71) (-2.17) (-0.39)<br />
Cash flow volatility 0.0035*** -0.0006 0.0005*** -0.0002 0.0005***<br />
(4.72) (-0.18) (4.65) (-0.18) (4.97)<br />
Year dummies yes yes yes yes yes<br />
Industry dummies yes yes yes yes yes<br />
Observati<strong>on</strong>s 3633 3859 3633 3859 3859<br />
Column <strong>on</strong>e shows results of a beta regressi<strong>on</strong> with 0 < BR < 1 as the dependent variable. Column<br />
two shows results of a logit regressi<strong>on</strong> with the dependent variable y = 1 if BR = 0. Columns three<br />
and four show estimates of the effect of a 1-standard deviati<strong>on</strong> change in x k , with x l evaluated at its<br />
mean ∀l ≠ k, and based <strong>on</strong> the marginal effects calculated from the estimates in columns <strong>on</strong>e and two<br />
(similar to columns <strong>on</strong>e and three of Table 3.4, see the capti<strong>on</strong> of Table 3.4 for an example). Column<br />
five shows the combined estimate of a 1-standard deviati<strong>on</strong> change in x k <strong>on</strong> the dependent variable<br />
0 ≤ BR < 1. Explanatory variables are defined in Table 3.2. All m<strong>on</strong>etary variables are adjusted for<br />
inflati<strong>on</strong>. All regressi<strong>on</strong>s include year and industry dummies. z-values in parentheses are calculated as<br />
coefficient estimates over robust standard errors. Significance levels of 1, 5 and 10 percent are indicated<br />
by ***, ** and *, respectively.<br />
154


