

Three Essays on Executive Compensation - KOPS - Universität ...
Three Essays on Executive Compensation - KOPS - Universität ...
Three Essays on Executive Compensation - KOPS - Universität ...

You also want an ePaper? Increase the reach of your titles
YUMPU automatically turns print PDFs into web optimized ePapers that Google loves.
Profit Sharing with <strong>Executive</strong>s<br />
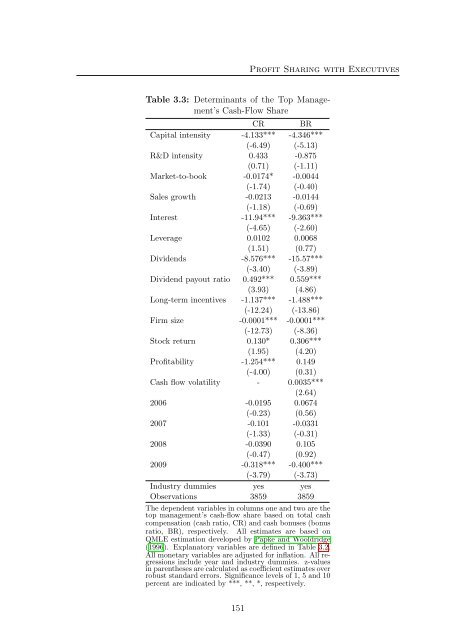
Table 3.3: Determinants of the Top Management’s<br />
Cash-Flow Share<br />
CR BR<br />
Capital intensity -4.133*** -4.346***<br />
(-6.49) (-5.13)<br />
R&D intensity 0.433 -0.875<br />
(0.71) (-1.11)<br />
Market-to-book -0.0174* -0.0044<br />
(-1.74) (-0.40)<br />
Sales growth -0.0213 -0.0144<br />
(-1.18) (-0.69)<br />
Interest -11.94*** -9.363***<br />
(-4.65) (-2.60)<br />
Leverage 0.0102 0.0068<br />
(1.51) (0.77)<br />
Dividends -8.576*** -15.57***<br />
(-3.40) (-3.89)<br />
Dividend payout ratio 0.492*** 0.559***<br />
(3.93) (4.86)<br />
L<strong>on</strong>g-term incentives -1.137*** -1.488***<br />
(-12.24) (-13.86)<br />
Firm size -0.0001*** -0.0001***<br />
(-12.73) (-8.36)<br />
Stock return 0.130* 0.306***<br />
(1.95) (4.20)<br />
Profitability -1.254*** 0.149<br />
(-4.00) (0.31)<br />
Cash flow volatility - 0.0035***<br />
(2.64)<br />
2006 -0.0195 0.0674<br />
(-0.23) (0.56)<br />
2007 -0.101 -0.0331<br />
(-1.33) (-0.31)<br />
2008 -0.0390 0.105<br />
(-0.47) (0.92)<br />
2009 -0.318*** -0.400***<br />
(-3.79) (-3.73)<br />
Industry dummies yes yes<br />
Observati<strong>on</strong>s 3859 3859<br />
The dependent variables in columns <strong>on</strong>e and two are the<br />
top management’s cash-flow share based <strong>on</strong> total cash<br />
compensati<strong>on</strong> (cash ratio, CR) and cash b<strong>on</strong>uses (b<strong>on</strong>us<br />
ratio, BR), respectively. All estimates are based <strong>on</strong><br />
QMLE estimati<strong>on</strong> developed by Papke and Wooldridge<br />
(1996). Explanatory variables are defined in Table 3.2.<br />
All m<strong>on</strong>etary variables are adjusted for inflati<strong>on</strong>. All regressi<strong>on</strong>s<br />
include year and industry dummies. z-values<br />
in parentheses are calculated as coefficient estimates over<br />
robust standard errors. Significance levels of 1, 5 and 10<br />
percent are indicated by ***, **, *, respectively.<br />
151


