

Three Essays on Executive Compensation - KOPS - Universität ...
Three Essays on Executive Compensation - KOPS - Universität ...
Three Essays on Executive Compensation - KOPS - Universität ...

You also want an ePaper? Increase the reach of your titles
YUMPU automatically turns print PDFs into web optimized ePapers that Google loves.
<strong>Executive</strong> Compensati<strong>on</strong> and Firm Performance in Germany<br />
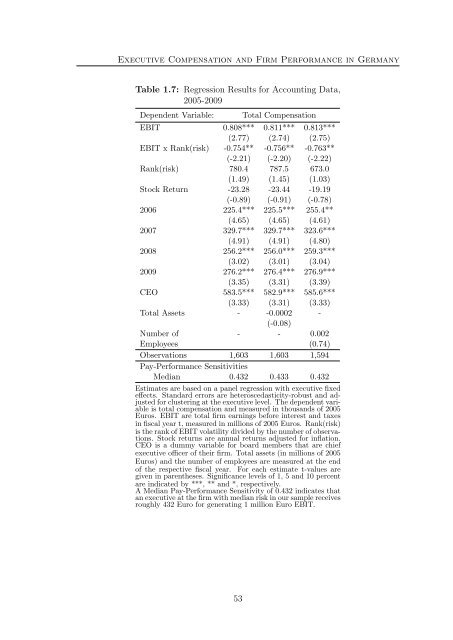
Table 1.7: Regressi<strong>on</strong> Results for Accounting Data,<br />
2005-2009<br />
Dependent Variable:<br />
Total Compensati<strong>on</strong><br />
EBIT 0.808*** 0.811*** 0.813***<br />
(2.77) (2.74) (2.75)<br />
EBIT x Rank(risk) -0.754** -0.756** -0.763**<br />
(-2.21) (-2.20) (-2.22)<br />
Rank(risk) 780.4 787.5 673.0<br />
(1.49) (1.45) (1.03)<br />
Stock Return -23.28 -23.44 -19.19<br />
(-0.89) (-0.91) (-0.78)<br />
2006 225.4*** 225.5*** 255.4**<br />
(4.65) (4.65) (4.61)<br />
2007 329.7*** 329.7*** 323.6***<br />
(4.91) (4.91) (4.80)<br />
2008 256.2*** 256.0*** 259.3***<br />
(3.02) (3.01) (3.04)<br />
2009 276.2*** 276.4*** 276.9***<br />
(3.35) (3.31) (3.39)<br />
CEO 583.5*** 582.9*** 585.6***<br />
(3.33) (3.31) (3.33)<br />
Total Assets - -0.0002 -<br />
(-0.08)<br />
Number of - - 0.002<br />
Employees (0.74)<br />
Observati<strong>on</strong>s 1,603 1,603 1,594<br />
Pay-Performance Sensitivities<br />
Median 0.432 0.433 0.432<br />
Estimates are based <strong>on</strong> a panel regressi<strong>on</strong> with executive fixed<br />
effects. Standard errors are heteroscedasticity-robust and adjusted<br />
for clustering at the executive level. The dependent variable<br />
is total compensati<strong>on</strong> and measured in thousands of 2005<br />
Euros. EBIT are total firm earnings before interest and taxes<br />
in fiscal year t, measured in milli<strong>on</strong>s of 2005 Euros. Rank(risk)<br />
is the rank of EBIT volatility divided by the number of observati<strong>on</strong>s.<br />
Stock returns are annual returns adjusted for inflati<strong>on</strong>.<br />
CEO is a dummy variable for board members that are chief<br />
executive officer of their firm. Total assets (in milli<strong>on</strong>s of 2005<br />
Euros) and the number of employees are measured at the end<br />
of the respective fiscal year. For each estimate t-values are<br />
given in parentheses. Significance levels of 1, 5 and 10 percent<br />
are indicated by ***, ** and *, respectively.<br />
A Median Pay-Performance Sensitivity of 0.432 indicates that<br />
an executive at the firm with median risk in our sample receives<br />
roughly 432 Euro for generating 1 milli<strong>on</strong> Euro EBIT.<br />
53


