

Three Essays on Executive Compensation - KOPS - Universität ...
Three Essays on Executive Compensation - KOPS - Universität ...
Three Essays on Executive Compensation - KOPS - Universität ...

Create successful ePaper yourself
Turn your PDF publications into a flip-book with our unique Google optimized e-Paper software.
Which Pay for what Performance? Evidence from <strong>Executive</strong><br />
Compensati<strong>on</strong> in Germany and the United States<br />
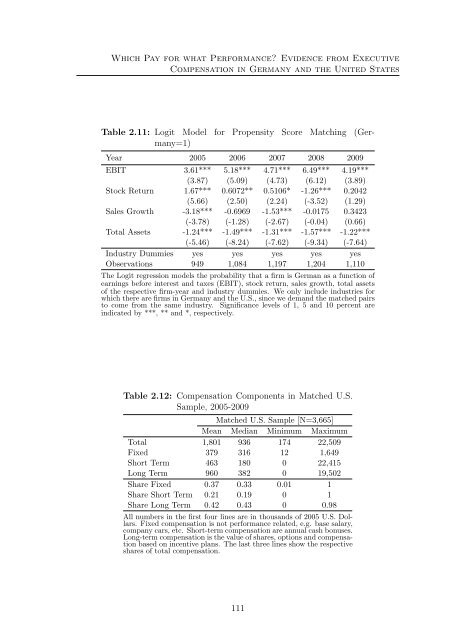
Table 2.11: Logit Model for Propensity Score Matching (Germany=1)<br />
Year 2005 2006 2007 2008 2009<br />
EBIT 3.61*** 5.18*** 4.71*** 6.49*** 4.19***<br />
(3.87) (5.09) (4.73) (6.12) (3.89)<br />
Stock Return 1.67*** 0.6072** 0.5106* -1.26*** 0.2042<br />
(5.66) (2.50) (2.24) (-3.52) (1.29)<br />
Sales Growth -3.18*** -0.6969 -1.53*** -0.0175 0.3423<br />
(-3.78) (-1.28) (-2.67) (-0.04) (0.66)<br />
Total Assets -1.24*** -1.49*** -1.31*** -1.57*** -1.22***<br />
(-5.46) (-8.24) (-7.62) (-9.34) (-7.64)<br />
Industry Dummies yes yes yes yes yes<br />
Observati<strong>on</strong>s 949 1,084 1,197 1,204 1,110<br />
The Logit regressi<strong>on</strong> models the probability that a firm is German as a functi<strong>on</strong> of<br />
earnings before interest and taxes (EBIT), stock return, sales growth, total assets<br />
of the respective firm-year and industry dummies. We <strong>on</strong>ly include industries for<br />
which there are firms in Germany and the U.S., since we demand the matched pairs<br />
to come from the same industry. Significance levels of 1, 5 and 10 percent are<br />
indicated by ***, ** and *, respectively.<br />
Table 2.12: Compensati<strong>on</strong> Comp<strong>on</strong>ents in Matched U.S.<br />
Sample, 2005-2009<br />
Matched U.S. Sample [N=3,665]<br />
Mean Median Minimum Maximum<br />
Total 1,801 936 174 22,509<br />
Fixed 379 316 12 1,649<br />
Short Term 463 180 0 22,415<br />
L<strong>on</strong>g Term 960 382 0 19,502<br />
Share Fixed 0.37 0.33 0.01 1<br />
Share Short Term 0.21 0.19 0 1<br />
Share L<strong>on</strong>g Term 0.42 0.43 0 0.98<br />
All numbers in the first four lines are in thousands of 2005 U.S. Dollars.<br />
Fixed compensati<strong>on</strong> is not performance related, e.g. base salary,<br />
company cars, etc. Short-term compensati<strong>on</strong> are annual cash b<strong>on</strong>uses.<br />
L<strong>on</strong>g-term compensati<strong>on</strong> is the value of shares, opti<strong>on</strong>s and compensati<strong>on</strong><br />
based <strong>on</strong> incentive plans. The last three lines show the respective<br />
shares of total compensati<strong>on</strong>.<br />
111


