

Three Essays on Executive Compensation - KOPS - Universität ...
Three Essays on Executive Compensation - KOPS - Universität ...
Three Essays on Executive Compensation - KOPS - Universität ...

You also want an ePaper? Increase the reach of your titles
YUMPU automatically turns print PDFs into web optimized ePapers that Google loves.
Profit Sharing with <strong>Executive</strong>s<br />
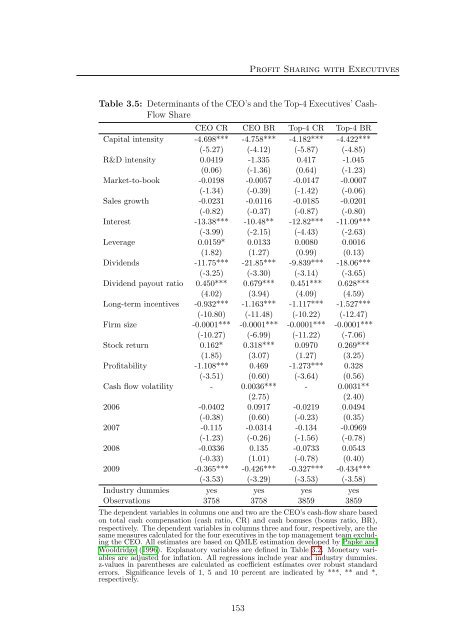
Table 3.5: Determinants of the CEO’s and the Top-4 <strong>Executive</strong>s’ Cash-<br />
Flow Share<br />
CEO CR CEO BR Top-4 CR Top-4 BR<br />
Capital intensity -4.698*** -4.758*** -4.182*** -4.422***<br />
(-5.27) (-4.12) (-5.87) (-4.85)<br />
R&D intensity 0.0419 -1.335 0.417 -1.045<br />
(0.06) (-1.36) (0.64) (-1.23)<br />
Market-to-book -0.0198 -0.0057 -0.0147 -0.0007<br />
(-1.34) (-0.39) (-1.42) (-0.06)<br />
Sales growth -0.0231 -0.0116 -0.0185 -0.0201<br />
(-0.82) (-0.37) (-0.87) (-0.80)<br />
Interest -13.38*** -10.48** -12.82*** -11.09***<br />
(-3.99) (-2.15) (-4.43) (-2.63)<br />
Leverage 0.0159* 0.0133 0.0080 0.0016<br />
(1.82) (1.27) (0.99) (0.13)<br />
Dividends -11.75*** -21.85*** -9.839*** -18.06***<br />
(-3.25) (-3.30) (-3.14) (-3.65)<br />
Dividend payout ratio 0.450*** 0.679*** 0.451*** 0.628***<br />
(4.02) (3.94) (4.09) (4.59)<br />
L<strong>on</strong>g-term incentives -0.932*** -1.163*** -1.117*** -1.527***<br />
(-10.80) (-11.48) (-10.22) (-12.47)<br />
Firm size -0.0001*** -0.0001*** -0.0001*** -0.0001***<br />
(-10.27) (-6.99) (-11.22) (-7.06)<br />
Stock return 0.162* 0.318*** 0.0970 0.269***<br />
(1.85) (3.07) (1.27) (3.25)<br />
Profitability -1.108*** 0.469 -1.273*** 0.328<br />
(-3.51) (0.60) (-3.64) (0.56)<br />
Cash flow volatility - 0.0036*** - 0.0031**<br />
(2.75) (2.40)<br />
2006 -0.0402 0.0917 -0.0219 0.0494<br />
(-0.38) (0.60) (-0.23) (0.35)<br />
2007 -0.115 -0.0314 -0.134 -0.0969<br />
(-1.23) (-0.26) (-1.56) (-0.78)<br />
2008 -0.0336 0.135 -0.0733 0.0543<br />
(-0.33) (1.01) (-0.78) (0.40)<br />
2009 -0.365*** -0.426*** -0.327*** -0.434***<br />
(-3.53) (-3.29) (-3.53) (-3.58)<br />
Industry dummies yes yes yes yes<br />
Observati<strong>on</strong>s 3758 3758 3859 3859<br />
The dependent variables in columns <strong>on</strong>e and two are the CEO’s cash-flow share based<br />
<strong>on</strong> total cash compensati<strong>on</strong> (cash ratio, CR) and cash b<strong>on</strong>uses (b<strong>on</strong>us ratio, BR),<br />
respectively. The dependent variables in columns three and four, respectively, are the<br />
same measures calculated for the four executives in the top management team excluding<br />
the CEO. All estimates are based <strong>on</strong> QMLE estimati<strong>on</strong> developed by Papke and<br />
Wooldridge (1996). Explanatory variables are defined in Table 3.2. M<strong>on</strong>etary variables<br />
are adjusted for inflati<strong>on</strong>. All regressi<strong>on</strong>s include year and industry dummies.<br />
z-values in parentheses are calculated as coefficient estimates over robust standard<br />
errors. Significance levels of 1, 5 and 10 percent are indicated by ***, ** and *,<br />
respectively.<br />
153


