

Three Essays on Executive Compensation - KOPS - Universität ...
Three Essays on Executive Compensation - KOPS - Universität ...
Three Essays on Executive Compensation - KOPS - Universität ...

You also want an ePaper? Increase the reach of your titles
YUMPU automatically turns print PDFs into web optimized ePapers that Google loves.
<strong>Executive</strong> Compensati<strong>on</strong> and Firm Performance in Germany<br />
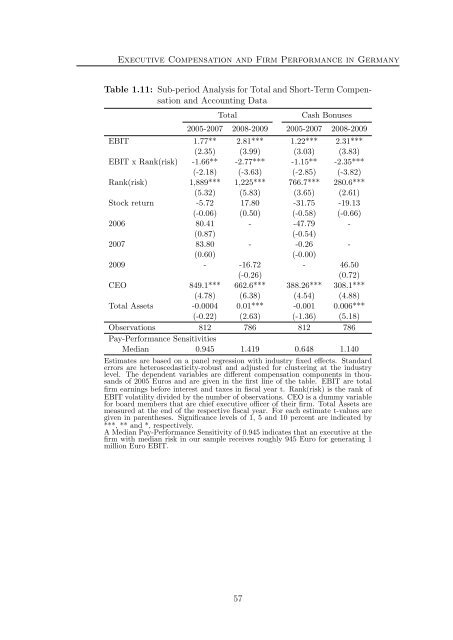
Table 1.11: Sub-period Analysis for Total and Short-Term Compensati<strong>on</strong><br />
and Accounting Data<br />
Total<br />
Cash B<strong>on</strong>uses<br />
2005-2007 2008-2009 2005-2007 2008-2009<br />
EBIT 1.77** 2.81*** 1.22*** 2.31***<br />
(2.35) (3.99) (3.03) (3.83)<br />
EBIT x Rank(risk) -1.66** -2.77*** -1.15** -2.35***<br />
(-2.18) (-3.63) (-2.85) (-3.82)<br />
Rank(risk) 1,889*** 1,225*** 766.7*** 280.6***<br />
(5.32) (5.83) (3.65) (2.61)<br />
Stock return -5.72 17.80 -31.75 -19.13<br />
(-0.06) (0.50) (-0.58) (-0.66)<br />
2006 80.41 - -47.79 -<br />
(0.87) (-0.54)<br />
2007 83.80 - -0.26 -<br />
(0.60) (-0.00)<br />
2009 - -16.72 - 46.50<br />
(-0.26) (0.72)<br />
CEO 849.1*** 662.6*** 388.26*** 308.1***<br />
(4.78) (6.38) (4.54) (4.88)<br />
Total Assets -0.0004 0.01*** -0.001 0.006***<br />
(-0.22) (2.63) (-1.36) (5.18)<br />
Observati<strong>on</strong>s 812 786 812 786<br />
Pay-Performance Sensitivities<br />
Median 0.945 1.419 0.648 1.140<br />
Estimates are based <strong>on</strong> a panel regressi<strong>on</strong> with industry fixed effects. Standard<br />
errors are heteroscedasticity-robust and adjusted for clustering at the industry<br />
level. The dependent variables are different compensati<strong>on</strong> comp<strong>on</strong>ents in thousands<br />
of 2005 Euros and are given in the first line of the table. EBIT are total<br />
firm earnings before interest and taxes in fiscal year t. Rank(risk) is the rank of<br />
EBIT volatility divided by the number of observati<strong>on</strong>s. CEO is a dummy variable<br />
for board members that are chief executive officer of their firm. Total Assets are<br />
measured at the end of the respective fiscal year. For each estimate t-values are<br />
given in parentheses. Significance levels of 1, 5 and 10 percent are indicated by<br />
***, ** and *, respectively.<br />
A Median Pay-Performance Sensitivity of 0.945 indicates that an executive at the<br />
firm with median risk in our sample receives roughly 945 Euro for generating 1<br />
milli<strong>on</strong> Euro EBIT.<br />
57


