

Three Essays on Executive Compensation - KOPS - Universität ...
Three Essays on Executive Compensation - KOPS - Universität ...
Three Essays on Executive Compensation - KOPS - Universität ...

Create successful ePaper yourself
Turn your PDF publications into a flip-book with our unique Google optimized e-Paper software.
Profit Sharing with <strong>Executive</strong>s<br />
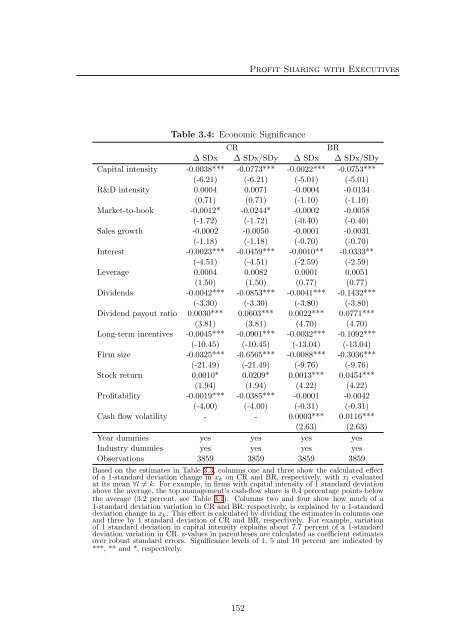
Table 3.4: Ec<strong>on</strong>omic Significance<br />
CR<br />
BR<br />
∆ SDx ∆ SDx/SDy ∆ SDx ∆ SDx/SDy<br />
Capital intensity -0.0038*** -0.0773*** -0.0022*** -0.0753***<br />
(-6.21) (-6.21) (-5.01) (-5.01)<br />
R&D intensity 0.0004 0.0071 -0.0004 -0.0134<br />
(0.71) (0.71) (-1.10) (-1.10)<br />
Market-to-book -0.0012* -0.0244* -0.0002 -0.0058<br />
(-1.72) (-1.72) (-0.40) (-0.40)<br />
Sales growth -0.0002 -0.0050 -0.0001 -0.0031<br />
(-1.18) (-1.18) (-0.70) (-0.70)<br />
Interest -0.0023*** -0.0459*** -0.0010** -0.0333**<br />
(-4.51) (-4.51) (-2.59) (-2.59)<br />
Leverage 0.0004 0.0082 0.0001 0.0051<br />
(1.50) (1.50) (0.77) (0.77)<br />
Dividends -0.0042*** -0.0853*** -0.0041*** -0.1432***<br />
(-3.30) (-3.30) (-3.80) (-3.80)<br />
Dividend payout ratio 0.0030*** 0.0603*** 0.0022*** 0.0771***<br />
(3.81) (3.81) (4.70) (4.70)<br />
L<strong>on</strong>g-term incentives -0.0045*** -0.0901*** -0.0032*** -0.1092***<br />
(-10.45) (-10.45) (-13.04) (-13.04)<br />
Firm size -0.0325*** -0.6565*** -0.0088*** -0.3036***<br />
(-21.49) (-21.49) (-9.76) (-9.76)<br />
Stock return 0.0010* 0.0209* 0.0013*** 0.0454***<br />
(1.94) (1.94) (4.22) (4.22)<br />
Profitability -0.0019*** -0.0385*** -0.0001 -0.0042<br />
(-4.00) (-4.00) (-0.31) (-0.31)<br />
Cash flow volatility - - 0.0003*** 0.0116***<br />
(2.63) (2.63)<br />
Year dummies yes yes yes yes<br />
Industry dummies yes yes yes yes<br />
Observati<strong>on</strong>s 3859 3859 3859 3859<br />
Based <strong>on</strong> the estimates in Table 3.3, columns <strong>on</strong>e and three show the calculated effect<br />
of a 1-standard deviati<strong>on</strong> change in x k <strong>on</strong> CR and BR, respectively, with x l evaluated<br />
at its mean ∀l ≠ k. For example, in firms with capital intensity of 1 standard deviati<strong>on</strong><br />
above the average, the top management’s cash-flow share is 0.4 percentage points below<br />
the average (3.2 percent, see Table 3.1). Columns two and four show how much of a<br />
1-standard deviati<strong>on</strong> variati<strong>on</strong> in CR and BR, respectively, is explained by a 1-standard<br />
deviati<strong>on</strong> change in x k . This effect is calculated by dividing the estimates in columns <strong>on</strong>e<br />
and three by 1 standard deviati<strong>on</strong> of CR and BR, respectively. For example, variati<strong>on</strong><br />
of 1 standard deviati<strong>on</strong> in capital intensity explains about 7.7 percent of a 1-standard<br />
deviati<strong>on</strong> variati<strong>on</strong> in CR. z-values in parentheses are calculated as coefficient estimates<br />
over robust standard errors. Significance levels of 1, 5 and 10 percent are indicated by<br />
***, ** and *, respectively.<br />
152


