SMS Siemag AG - Alu-web.de
SMS Siemag AG - Alu-web.de
SMS Siemag AG - Alu-web.de

You also want an ePaper? Increase the reach of your titles
YUMPU automatically turns print PDFs into web optimized ePapers that Google loves.
economy<br />
current picture of the primary aluminium industry<br />
This article is part of a comprehensive<br />
paper by Dr Carmine Nappi – ‘A Review<br />
of the Global <strong>Alu</strong>minium Industry: 1972-<br />
2012’ – published at www.worldaluminium.org.<br />
Reprinted by courtesy<br />
of the International <strong>Alu</strong>minium Institute<br />
(IAI).<br />
The geographic distribution of bauxite, alumina<br />
and aluminium production has shifted<br />
significantly since 1972. Starting with bauxite,<br />
while Australia increased its share of global<br />
output from 20% to 32% over the last<br />
40 years, Jamaica, Suriname and Russia are<br />
no longer on the list of the major producers,<br />
having been replaced by Brazil (15%), China<br />
(14%) and Indonesia (11%). The combined<br />
market share of the four largest producers is<br />
now over 70%.<br />
A complete relocation of producing centres<br />
has also been taking place in the global<br />
alumina industry. The production shares of<br />
Japan, Russia, Jamaica and Suriname have<br />
drastically shrunk since 1972 – and today four<br />
countries (China, 35%; Australia, 23%; Brazil,<br />
11%; India, 4%) have a combined share<br />
of 73% of global alumina output. While the<br />
BRIC countries now account for almost 40%<br />
of global bauxite output, this share jumps to<br />
53% for alumina. In the latter case, production<br />
has <strong>de</strong>finitely shifted towards countries<br />
with access to an abundant and inexpensive<br />
source of bauxite. In addition to being the<br />
most important cost element, the bauxite cost<br />
is the most important source of variation of<br />
alumina production cost. China has become<br />
the largest alumina producer, but continues<br />
to import a large share of its bauxite needs,<br />
mainly from Indonesia.<br />
If bauxite cost remains the most significant<br />
driver of the current location of alumina production,<br />
shifts in the geographic location of<br />
aluminium production is <strong>de</strong>termined to a large<br />
extent by variations in energy prices. Even if<br />
capital, alumina and energy costs account for<br />
about equal shares of total aluminium production<br />
costs, energy costs vary much more<br />
between countries than the two other cost<br />
elements; consequently, energy costs remain<br />
the most important <strong>de</strong>terminant of international<br />
differences in aluminium production<br />
costs (about 70% of the variability in aluminium’s<br />
total cost is linked to energy cost).<br />
Unsurprisingly, US share of global primary<br />
output has moved down from 32% in 1972 to<br />
only 4% in 2010. The same applies to Japan<br />
(its share dropping from 9% to nil during the<br />
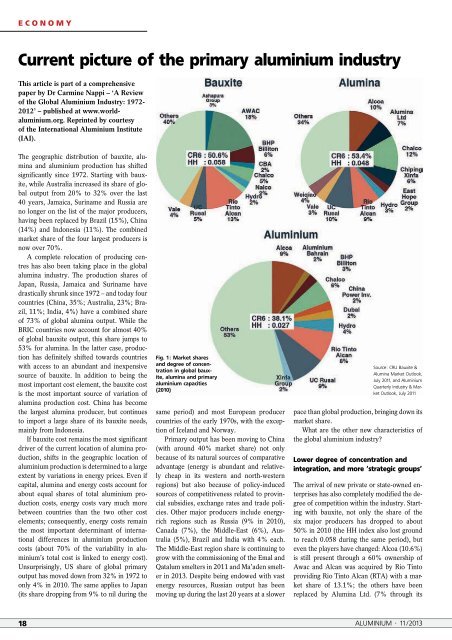
Fig. 1: Market shares<br />
and <strong>de</strong>gree of concentration<br />
in global bauxite,<br />
alumina and primary<br />
aluminium capacities<br />
(2010)<br />
same period) and most European producer<br />
countries of the early 1970s, with the exception<br />
of Iceland and Norway.<br />
Primary output has been moving to China<br />
(with around 40% market share) not only<br />
because of its natural sources of comparative<br />
advantage (energy is abundant and relatively<br />
cheap in its western and north-western<br />
regions) but also because of policy-induced<br />
sources of competitiveness related to provincial<br />
subsidies, exchange rates and tra<strong>de</strong> policies.<br />
Other major producers inclu<strong>de</strong> energyrich<br />
regions such as Russia (9% in 2010),<br />
Canada (7%), the Middle-East (6%), Australia<br />
(5%), Brazil and India with 4% each.<br />
The Middle-East region share is continuing to<br />
grow with the commissioning of the Emal and<br />
Qatalum smelters in 2011 and Ma’a<strong>de</strong>n smelter<br />
in 2013. Despite being endowed with vast<br />
energy resources, Russian output has been<br />
moving up during the last 20 years at a slower<br />
Source: CRU Bauxite &<br />
<strong>Alu</strong>mina Market Outlook,<br />
July 2011, and <strong>Alu</strong>minium<br />
Quarterly Industry & Market<br />
Outlook, July 2011<br />
pace than global production, bringing down its<br />
market share.<br />
What are the other new characteristics of<br />
the global aluminium industry?<br />
Lower <strong>de</strong>gree of concentration and<br />
integration, and more ‘strategic groups’<br />
The arrival of new private or state-owned enterprises<br />
has also completely modified the <strong>de</strong>gree<br />
of competition within the industry. Starting<br />
with bauxite, not only the share of the<br />
six major producers has dropped to about<br />
50% in 2010 (the HH in<strong>de</strong>x also lost ground<br />
to reach 0.058 during the same period), but<br />
even the players have changed: Alcoa (10.6%)<br />
is still present through a 60% ownership of<br />
Awac and Alcan was acquired by Rio Tinto<br />
providing Rio Tinto Alcan (RTA) with a market<br />
share of 13.1%; the others have been<br />
replaced by <strong>Alu</strong>mina Ltd. (7% through its<br />
18 ALUMINIUM · 11/2013