Predictive Control of Three Phase AC/DC Converters
Predictive Control of Three Phase AC/DC Converters
Predictive Control of Three Phase AC/DC Converters

Create successful ePaper yourself
Turn your PDF publications into a flip-book with our unique Google optimized e-Paper software.
Sector 2<br />
54 CHAPTER 4. PREDICTIVE DIRECT POWER CONTROL<br />
line voltage space vector position. The voltage plane is divided into twelve subsectors,<br />
exactly the same as in case <strong>of</strong> ST-DPC, see Fig. 3.9. The smallest current<br />
ripples can be achieved by application sequence <strong>of</strong> neighboring VSC vectors.<br />
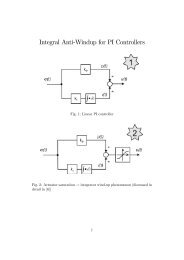
Figure 4.9 shows an example <strong>of</strong> vector selection. Line voltage space vector<br />
is located in the first sector, so the switching sequence <strong>of</strong> U P is set to {1, 2, 7}.<br />
Table 4.4 summarizes U P sequences for all sectors.<br />
β<br />
Sector 3<br />
(110)<br />
UP2<br />
(000)<br />
UP0<br />
(111)<br />
UP7<br />
α<br />
UL<br />
(100)<br />
UP1<br />
(101)<br />
1<br />
Sector 11 Sector 12<br />
UP6<br />
Figure 4.9: Converter voltage vector U P selection in 1st sector<br />
Figure 4.10 shows graphical representation <strong>of</strong> U P sequences for all sectors.<br />
As it can be seen in Fig. 4.10, switching table (Tab. 4.4) has been constructed in<br />
order to reduce transistors switching loses. Note that, the U P sequence has been<br />
chosen in such way that VSC leg switchings do not happen during maximum line<br />
current conduction, and there are only two switchings per sampling time T s .<br />
4.6.4 Voltage Vectors Application Times<br />
Taking into account (4.36) and constant switching frequency requirement, control<br />
method has to determine t 1 , t 2 and t 3 voltage vectors application times.<br />
The predicted power values at the end <strong>of</strong> sampling time P P 6 , Q P 6 are considered<br />
as a referenced ones P ref , Q ref .<br />
P ref = P P 6<br />
Q ref = Q P 6<br />
(4.37)


![[TCP] Opis układu - Instytut Sterowania i Elektroniki Przemysłowej ...](https://img.yumpu.com/23535443/1/184x260/tcp-opis-ukladu-instytut-sterowania-i-elektroniki-przemyslowej-.jpg?quality=85)