Predictive Control of Three Phase AC/DC Converters
Predictive Control of Three Phase AC/DC Converters
Predictive Control of Three Phase AC/DC Converters

Create successful ePaper yourself
Turn your PDF publications into a flip-book with our unique Google optimized e-Paper software.
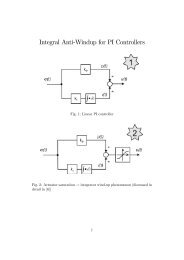
4.8. SIMULATION RESULTS 65<br />
200<br />
150<br />
100<br />
50<br />
(a)<br />
0.8<br />
0.6<br />
0.4<br />
0.2<br />
500<br />
400<br />
300<br />
200<br />
100<br />
(c)<br />
u P a<br />
u La ψ La<br />
0.2 0.205 0.21 0.215 0.22<br />
0<br />
0<br />
0<br />
−50<br />
−100<br />
−150<br />
−100<br />
−0.2<br />
−200<br />
−0.4<br />
−300<br />
−0.6<br />
−400<br />
−200<br />
0.2 0.205 0.21 0.215 0.22 −0.8<br />
−500<br />
0.2 0.205 0.21 0.215 0.22<br />
15<br />
10<br />
(b)<br />
2500<br />
2000<br />
(d)<br />
P Q<br />
i La<br />
0.2 0.205 0.21 0.215 0.22<br />
5<br />
1500<br />
0<br />
1000<br />
−5<br />
500<br />
−10<br />
0<br />
−15<br />
0.2 0.205 0.21 0.215 0.22<br />
−500<br />
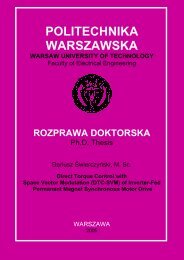
Figure 4.18: Steady state operation <strong>of</strong> VF-CSF-P-DPC: (a) line voltage u La [V]<br />
and estimated virtual flux ψ La [Wb], (b) line current i La [A], (c) VSC input voltage<br />
u P a [V], (d) referenced and measured active P [W] and reactive power Q [var]<br />
Figure 4.19 shows converter voltage, measured between converter phase a input,<br />
and negative <strong>DC</strong> bus u P a<strong>DC</strong>− as well as related number <strong>of</strong> transistor “on“<br />
and “<strong>of</strong>f “ switchings N Sa , per one cycle.<br />
For VSF-P-DPC and FL-VSF-P-DPC, N Sa goes around 180 and 150 switchings<br />
respectively, and in case <strong>of</strong> HC-VSF-P-DPC is about 325 what is caused by<br />
two times higher sampling frequency F s .<br />
Figure 4.19 shows also u P a<strong>DC</strong>− and N Sa for constant switching frequency<br />
approach. It can be seen that there is no transistor switchings under maximum<br />
current conduction. It allows to significantly reduce transistors commutation<br />
loses.<br />
Figure 4.20 shows line current i L harmonic spectrum up to 20 kHz. In case <strong>of</strong><br />
VSF-P-DPC and FL-VSF-P-DPC harmonic spectrum is spread over wide range <strong>of</strong><br />
frequencies. The HC-VSF-P-DPC allows to concentrate spectrum within desired<br />
frequency (in presented case around 4 kHz Fig. 4.5 (a)). For constant switching<br />
approach current spectrum is concentrated around maximum switching frequency<br />
F swMax , which leads to sampling F s .<br />
Table 4.7 summarizes T HD i factors. As it can been seen, the lowest T HD i<br />
is achieved by CSF approach (around 3.5% – 3.6%), also HC-VSF-P-DPC has<br />
low T HD i , however it is occupied by higher switching and sampling frequencies.

![[TCP] Opis układu - Instytut Sterowania i Elektroniki Przemysłowej ...](https://img.yumpu.com/23535443/1/184x260/tcp-opis-ukladu-instytut-sterowania-i-elektroniki-przemyslowej-.jpg?quality=85)