View - The Municipality of Lambton Shores
View - The Municipality of Lambton Shores
View - The Municipality of Lambton Shores

Create successful ePaper yourself
Turn your PDF publications into a flip-book with our unique Google optimized e-Paper software.
Schedule "A"<br />
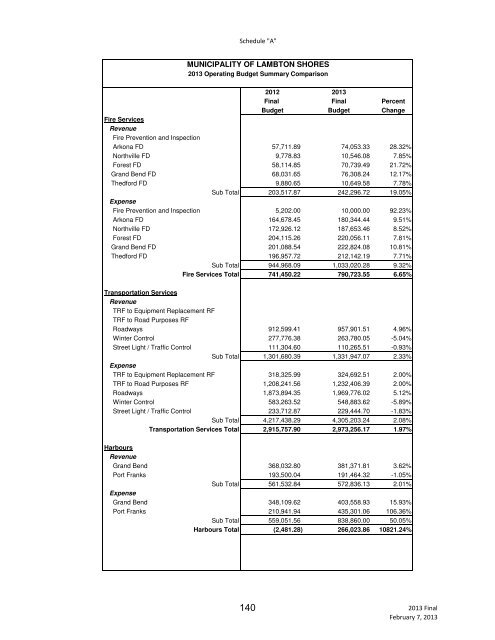
MUNICIPALITY OF LAMBTON SHORES<br />
2013 Operating Budget Summary Comparison<br />
2012 2013<br />
Final Final Percent<br />
Budget Budget Change<br />
Fire Services<br />
Revenue<br />
Fire Prevention and Inspection<br />
Arkona FD 57,711.89 74,053.33 28.32%<br />
Northville FD 9,778.83 10,546.08 7.85%<br />
Forest FD 58,114.85 70,739.49 21.72%<br />
Grand Bend FD 68,031.65 76,308.24 12.17%<br />
<strong>The</strong>dford FD 9,880.65 10,649.58 7.78%<br />
Sub Total 203,517.87 242,296.72 19.05%<br />
Expense<br />
Fire Prevention and Inspection 5,202.00 10,000.00 92.23%<br />
Arkona FD 164,678.45 180,344.44 9.51%<br />
Northville FD 172,926.12 187,653.46 8.52%<br />
Forest FD 204,115.26 220,056.11 7.81%<br />
Grand Bend FD 201,088.54 222,824.08 10.81%<br />
<strong>The</strong>dford FD 196,957.72 212,142.19 7.71%<br />
Sub Total 944,968.09 1,033,020.28 9.32%<br />
Fire Services Total 741,450.22 790,723.55 6.65%<br />
Transportation Services<br />
Revenue<br />
TRF to Equipment Replacement RF<br />
TRF to Road Purposes RF<br />
Roadways 912,599.41 957,901.51 4.96%<br />
Winter Control 277,776.38 263,780.05 -5.04%<br />
Street Light / Traffic Control 111,304.60 110,265.51 -0.93%<br />
Sub Total 1,301,680.39 1,331,947.07 2.33%<br />
Expense<br />
TRF to Equipment Replacement RF 318,325.99 324,692.51 2.00%<br />
TRF to Road Purposes RF 1,208,241.56 1,232,406.39 2.00%<br />
Roadways 1,873,894.35 1,969,776.02 5.12%<br />
Winter Control 583,263.52 548,883.62 -5.89%<br />
Street Light / Traffic Control 233,712.87 229,444.70 -1.83%<br />
Sub Total 4,217,438.29 4,305,203.24 2.08%<br />
Transportation Services Total 2,915,757.90 2,973,256.17 1.97%<br />
Harbours<br />
Revenue<br />
Grand Bend 368,032.80 381,371.81 3.62%<br />
Port Franks 193,500.04 191,464.32 -1.05%<br />
Sub Total 561,532.84 572,836.13 2.01%<br />
Expense<br />
Grand Bend 348,109.62 403,558.93 15.93%<br />
Port Franks 210,941.94 435,301.06 106.36%<br />
Sub Total 559,051.56 838,860.00 50.05%<br />
Harbours Total (2,481.28) 266,023.86 10821.24%<br />
140<br />
2013 Final<br />
February 7, 2013