View - The Municipality of Lambton Shores
View - The Municipality of Lambton Shores
View - The Municipality of Lambton Shores

Create successful ePaper yourself
Turn your PDF publications into a flip-book with our unique Google optimized e-Paper software.
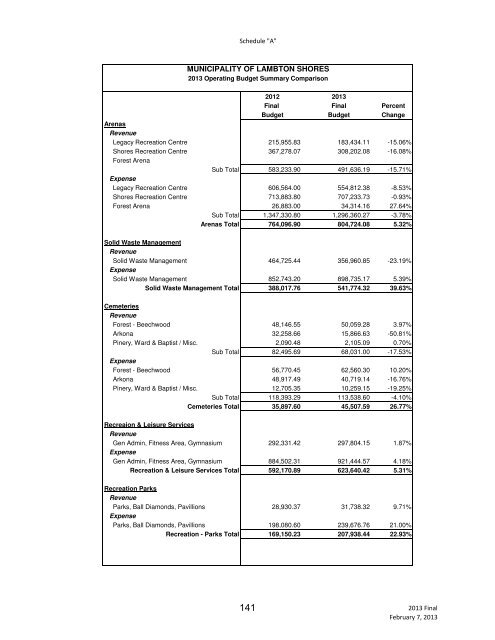
Schedule "A"<br />
MUNICIPALITY OF LAMBTON SHORES<br />
2013 Operating Budget Summary Comparison<br />
2012 2013<br />
Final Final Percent<br />
Budget Budget Change<br />
Arenas<br />
Revenue<br />
Legacy Recreation Centre 215,955.83 183,434.11 -15.06%<br />
<strong>Shores</strong> Recreation Centre 367,278.07 308,202.08 -16.08%<br />
Forest Arena<br />
Sub Total 583,233.90 491,636.19 -15.71%<br />
Expense<br />
Legacy Recreation Centre 606,564.00 554,812.38 -8.53%<br />
<strong>Shores</strong> Recreation Centre 713,883.80 707,233.73 -0.93%<br />
Forest Arena 26,883.00 34,314.16 27.64%<br />
Sub Total 1,347,330.80 1,296,360.27 -3.78%<br />
Arenas Total 764,096.90 804,724.08 5.32%<br />
Solid Waste Management<br />
Revenue<br />
Solid Waste Management 464,725.44 356,960.85 -23.19%<br />
Expense<br />
Solid Waste Management 852,743.20 898,735.17 5.39%<br />
Solid Waste Management Total 388,017.76 541,774.32 39.63%<br />
Cemeteries<br />
Revenue<br />
Forest - Beechwood 48,146.55 50,059.28 3.97%<br />
Arkona 32,258.66 15,866.63 -50.81%<br />
Pinery, Ward & Baptist / Misc. 2,090.48 2,105.09 0.70%<br />
Sub Total 82,495.69 68,031.00 -17.53%<br />
Expense<br />
Forest - Beechwood 56,770.45 62,560.30 10.20%<br />
Arkona 48,917.49 40,719.14 -16.76%<br />
Pinery, Ward & Baptist / Misc. 12,705.35 10,259.15 -19.25%<br />
Sub Total 118,393.29 113,538.60 -4.10%<br />
Cemeteries Total 35,897.60 45,507.59 26.77%<br />
Recreaion & Leisure Services<br />
Revenue<br />
Gen Admin, Fitness Area, Gymnasium 292,331.42 297,804.15 1.87%<br />
Expense<br />
Gen Admin, Fitness Area, Gymnasium 884,502.31 921,444.57 4.18%<br />
Recreation & Leisure Services Total 592,170.89 623,640.42 5.31%<br />
Recreation Parks<br />
Revenue<br />
Parks, Ball Diamonds, Pavillions 28,930.37 31,738.32 9.71%<br />
Expense<br />
Parks, Ball Diamonds, Pavillions 198,080.60 239,676.76 21.00%<br />
Recreation - Parks Total 169,150.23 207,938.44 22.93%<br />
141<br />
2013 Final<br />
February 7, 2013