Europes ecological backbone.pdf
Europes ecological backbone.pdf
Europes ecological backbone.pdf

You also want an ePaper? Increase the reach of your titles
YUMPU automatically turns print PDFs into web optimized ePapers that Google loves.
The water towers of Europe<br />
changes to the frequency of calm summer days are<br />
more significant (George et al., 2007; George, 2010).<br />
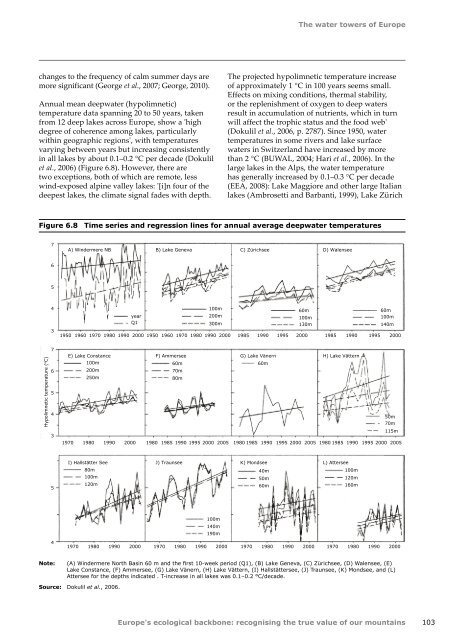
Annual mean deepwater (hypolimnetic)<br />
temperature data spanning 20 to 50 years, taken<br />
from 12 deep lakes across Europe, show a 'high<br />
degree of coherence among lakes, particularly<br />
within geographic regions', with temperatures<br />
varying between years but increasing consistently<br />
in all lakes by about 0.1–0.2 °C per decade (Dokulil<br />
et al., 2006) (Figure 6.8). However, there are<br />
two exceptions, both of which are remote, less<br />
wind‐exposed alpine valley lakes: '[i]n four of the<br />
deepest lakes, the climate signal fades with depth.<br />
The projected hypolimnetic temperature increase<br />
of approximately 1 °C in 100 years seems small.<br />
Effects on mixing conditions, thermal stability,<br />
or the replenishment of oxygen to deep waters<br />
result in accumulation of nutrients, which in turn<br />
will affect the trophic status and the food web'<br />
(Dokulil et al., 2006, p. 2787). Since 1950, water<br />
temperatures in some rivers and lake surface<br />
waters in Switzerland have increased by more<br />
than 2 °C (BUWAL, 2004; Hari et al., 2006). In the<br />
large lakes in the Alps, the water temperature<br />
has generally increased by 0.1–0.3 °C per decade<br />
(EEA, 2008): Lake Maggiore and other large Italian<br />
lakes (Ambrosetti and Barbanti, 1999), Lake Zürich<br />
Figure 6.8 Time series and regression lines for annual average deepwater temperatures<br />
7<br />
A) Windermere NB<br />
B) Lake Geneva<br />
C) Zürichsee<br />
D) Walensee<br />
6<br />
5<br />
4<br />
3<br />
year<br />
Q1<br />
100m<br />
200m<br />
300m<br />
1950 1960 1970 1980 1990 2000 1950 1960 1970 1980 1990 2000 1985 1990 1995 2000 1985 1990 1995 2000<br />
60m<br />
100m<br />
130m<br />
60m<br />
100m<br />
140m<br />
Hypolimnetic temperature ( o C)<br />
7<br />
6<br />
5<br />
4<br />
3<br />
E) Lake Constance F) Ammersee G) Lake Vänern H) Lake Vättern<br />
100m<br />
60m<br />
60m<br />
200m<br />
70m<br />
250m<br />
80m<br />
50m<br />
70m<br />
115m<br />
1970 1980 1990 2000 1980 1985 1990 1995 2000 2005 1980 1985 1990 1995 2000 2005 1980 1985 1990 1995 2000 2005<br />
I) Hallstätter See<br />
J) Traunsee<br />
K) Mondsee<br />
L) Attersee<br />
5<br />
80m<br />
100m<br />
120m<br />
40m<br />
50m<br />
60m<br />
100m<br />
120m<br />
160m<br />
100m<br />
140m<br />
190m<br />
4<br />
1970 1980 1990<br />
2000<br />
1970 1980<br />
1990 2000<br />
1970 1980<br />
1990 2000 1970 1980<br />
1990 2000<br />
Note:<br />
(A) Windermere North Basin 60 m and the first 10-week period (Q1), (B) Lake Geneva, (C) Zürichsee, (D) Walensee, (E)<br />
Lake Constance, (F) Ammersee, (G) Lake Vänern, (H) Lake Vättern, (I) Hallstättersee, (J) Traunsee, (K) Mondsee, and (L)<br />
Attersee for the depths indicated . T-increase in all lakes was 0.1–0.2 °C/decade.<br />
Source: Dokulil et al., 2006.<br />
Europe's <strong>ecological</strong> <strong>backbone</strong>: recognising the true value of our mountains<br />
103