Europes ecological backbone.pdf
Europes ecological backbone.pdf
Europes ecological backbone.pdf

You also want an ePaper? Increase the reach of your titles
YUMPU automatically turns print PDFs into web optimized ePapers that Google loves.
Mountain economies and accessibility<br />
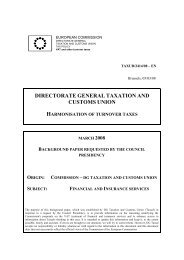
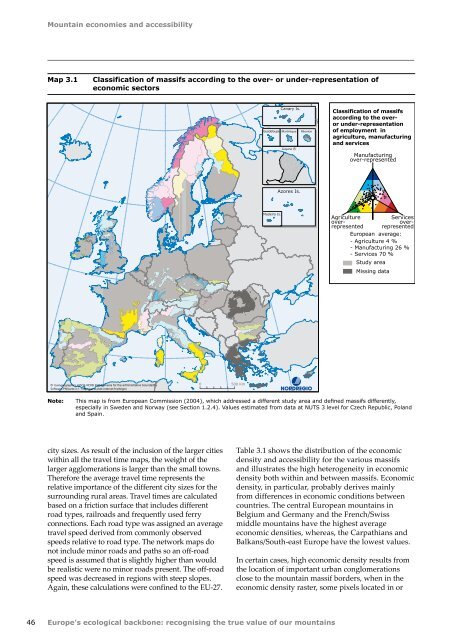
Map 3.1<br />
Classification of massifs according to the over- or under-representation of<br />
economic sectors<br />
Canary Is.<br />
Guadeloupe Martinique Réunion<br />
Guyane (F)<br />
Classification of massifs<br />
according to the overor<br />
under-representation<br />
of employment in<br />
agriculture, manufacturing<br />
and services<br />
Manufacturing<br />
over-represented<br />
Azores Is.<br />
Madeira Is.<br />
Agriculture<br />
overrepresented<br />
European average:<br />
- Agriculture 4 %<br />
- Manufacturing 26 %<br />
- Services 70 %<br />
Study area<br />
Missing data<br />
Services<br />
overrepresented<br />
© Eurogeographics, GISCO, NCRD, ESRI Romania for the administrative boundaries<br />
Software: Philcarto 3.1 - http://perso.club-internet.fr/philgeo<br />
0 500 Km<br />
Note:<br />
This map is from European Commission (2004), which addressed a different study area and defined massifs differently,<br />
especially in Sweden and Norway (see Section 1.2.4). Values estimated from data at NUTS 3 level for Czech Republic, Poland<br />
and Spain.<br />
city sizes. As result of the inclusion of the larger cities<br />
within all the travel time maps, the weight of the<br />
larger agglomerations is larger than the small towns.<br />
Therefore the average travel time represents the<br />
relative importance of the different city sizes for the<br />
surrounding rural areas. Travel times are calculated<br />
based on a friction surface that includes different<br />
road types, railroads and frequently used ferry<br />
connections. Each road type was assigned an average<br />
travel speed derived from commonly observed<br />
speeds relative to road type. The network maps do<br />
not include minor roads and paths so an off-road<br />
speed is assumed that is slightly higher than would<br />
be realistic were no minor roads present. The off-road<br />
speed was decreased in regions with steep slopes.<br />
Again, these calculations were confined to the EU‐27.<br />
Table 3.1 shows the distribution of the economic<br />
density and accessibility for the various massifs<br />
and illustrates the high heterogeneity in economic<br />
density both within and between massifs. Economic<br />
density, in particular, probably derives mainly<br />
from differences in economic conditions between<br />
countries. The central European mountains in<br />
Belgium and Germany and the French/Swiss<br />
middle mountains have the highest average<br />
economic densities, whereas, the Carpathians and<br />
Balkans/South-east Europe have the lowest values.<br />
In certain cases, high economic density results from<br />
the location of important urban conglomerations<br />
close to the mountain massif borders, when in the<br />
economic density raster, some pixels located in or<br />
46 Europe's <strong>ecological</strong> <strong>backbone</strong>: recognising the true value of our mountains