Europes ecological backbone.pdf
Europes ecological backbone.pdf
Europes ecological backbone.pdf

Create successful ePaper yourself
Turn your PDF publications into a flip-book with our unique Google optimized e-Paper software.
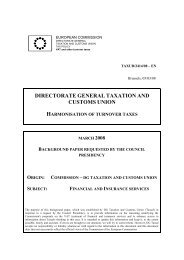
Protected areas<br />
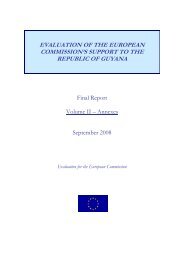
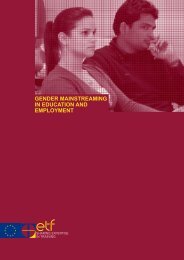
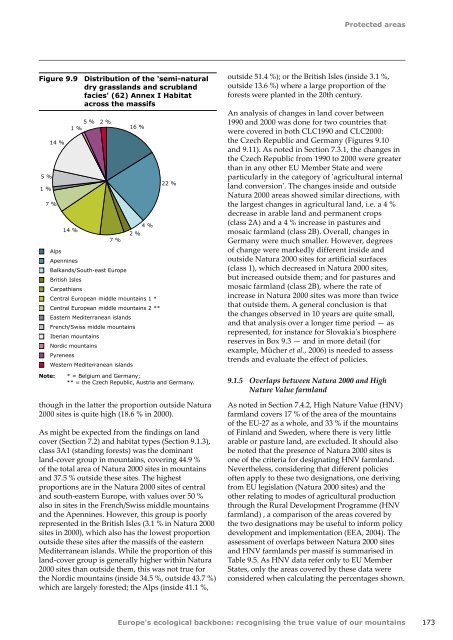
Figure 9.9 Distribution of the 'semi-natural<br />
dry grasslands and scrubland<br />
facies' (62) Annex I Habitat<br />
across the massifs<br />
5 %<br />
1 %<br />
14 %<br />
7 %<br />
14 %<br />
5 % 2 %<br />
1 %<br />
7 %<br />
16 %<br />
4 %<br />
2 %<br />
Alps<br />
Apennines<br />
Balkands/South-east Europe<br />
British Isles<br />
Carpathians<br />
Central European middle mountains 1 *<br />
Central European middle mountains 2 **<br />
Eastern Mediterranean islands<br />
French/Swiss middle mountains<br />
Iberian mountains<br />
Nordic mountains<br />
Pyrenees<br />
Western Mediterranean islands<br />
22 %<br />
outside 51.4 %); or the British Isles (inside 3.1 %,<br />
outside 13.6 %) where a large proportion of the<br />
forests were planted in the 20th century.<br />
An analysis of changes in land cover between<br />
1990 and 2000 was done for two countries that<br />
were covered in both CLC1990 and CLC2000:<br />
the Czech Republic and Germany (Figures 9.10<br />
and 9.11). As noted in Section 7.3.1, the changes in<br />
the Czech Republic from 1990 to 2000 were greater<br />
than in any other EU Member State and were<br />
particularly in the category of 'agricultural internal<br />
land conversion'. The changes inside and outside<br />
Natura 2000 areas showed similar directions, with<br />
the largest changes in agricultural land, i.e. a 4 %<br />
decrease in arable land and permanent crops<br />
(class 2A) and a 4 % increase in pastures and<br />
mosaic farmland (class 2B). Overall, changes in<br />
Germany were much smaller. However, degrees<br />
of change were markedly different inside and<br />
outside Natura 2000 sites for artificial surfaces<br />
(class 1), which decreased in Natura 2000 sites,<br />
but increased outside them; and for pastures and<br />
mosaic farmland (class 2B), where the rate of<br />
increase in Natura 2000 sites was more than twice<br />
that outside them. A general conclusion is that<br />
the changes observed in 10 years are quite small,<br />
and that analysis over a longer time period — as<br />
represented, for instance for Slovakia's biosphere<br />
reserves in Box 9.3 — and in more detail (for<br />
example, Mücher et al., 2006) is needed to assess<br />
trends and evaluate the effect of policies.<br />
Note:<br />
* = Belgium and Germany;<br />
** = the Czech Republic, Austria and Germany.<br />
9.1.5 Overlaps between Natura 2000 and High<br />
Nature Value farmland<br />
though in the latter the proportion outside Natura<br />
2000 sites is quite high (18.6 % in 2000).<br />
As might be expected from the findings on land<br />
cover (Section 7.2) and habitat types (Section 9.1.3),<br />
class 3A1 (standing forests) was the dominant<br />
land‐cover group in mountains, covering 44.9 %<br />
of the total area of Natura 2000 sites in mountains<br />
and 37.5 % outside these sites. The highest<br />
proportions are in the Natura 2000 sites of central<br />
and south‐eastern Europe, with values over 50 %<br />
also in sites in the French/Swiss middle mountains<br />
and the Apennines. However, this group is poorly<br />
represented in the British Isles (3.1 % in Natura 2000<br />
sites in 2000), which also has the lowest proportion<br />
outside these sites after the massifs of the eastern<br />
Mediterranean islands. While the proportion of this<br />
land‐cover group is generally higher within Natura<br />
2000 sites than outside them, this was not true for<br />
the Nordic mountains (inside 34.5 %, outside 43.7 %)<br />
which are largely forested; the Alps (inside 41.1 %,<br />
As noted in Section 7.4.2, High Nature Value (HNV)<br />
farmland covers 17 % of the area of the mountains<br />
of the EU‐27 as a whole, and 33 % if the mountains<br />
of Finland and Sweden, where there is very little<br />
arable or pasture land, are excluded. It should also<br />
be noted that the presence of Natura 2000 sites is<br />
one of the criteria for designating HNV farmland.<br />
Nevertheless, considering that different policies<br />
often apply to these two designations, one deriving<br />
from EU legislation (Natura 2000 sites) and the<br />
other relating to modes of agricultural production<br />
through the Rural Development Programme (HNV<br />
farmland) , a comparison of the areas covered by<br />
the two designations may be useful to inform policy<br />
development and implementation (EEA, 2004). The<br />
assessment of overlaps between Natura 2000 sites<br />
and HNV farmlands per massif is summarised in<br />
Table 9.5. As HNV data refer only to EU Member<br />
States, only the areas covered by these data were<br />
considered when calculating the percentages shown.<br />
Europe's <strong>ecological</strong> <strong>backbone</strong>: recognising the true value of our mountains<br />
173