Europes ecological backbone.pdf
Europes ecological backbone.pdf
Europes ecological backbone.pdf

You also want an ePaper? Increase the reach of your titles
YUMPU automatically turns print PDFs into web optimized ePapers that Google loves.
Integrated approaches to understanding mountain regions<br />
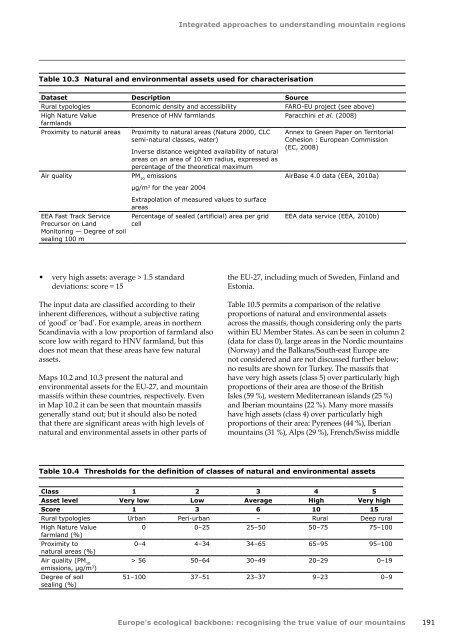
Table 10.3 Natural and environmental assets used for characterisation<br />
Dataset Description Source<br />
Rural typologies Economic density and accessibility FARO-EU project (see above)<br />
High Nature Value<br />
Presence of HNV farmlands Paracchini et al. (2008)<br />
farmlands<br />
Proximity to natural areas Proximity to natural areas (Natura 2000, CLC<br />
semi-natural classes, water)<br />
Air quality<br />
Inverse distance weighted availability of natural<br />
areas on an area of 10 km radius, expressed as<br />
percentage of the theoretical maximum<br />
PM 10<br />
emissions<br />
µg/m 3 for the year 2004<br />
Annex to Green Paper on Territorial<br />
Cohesion : European Commission<br />
(EC, 2008)<br />
AirBase 4.0 data (EEA, 2010a)<br />
EEA Fast Track Service<br />
Precursor on Land<br />
Monitoring — Degree of soil<br />
sealing 100 m<br />
Extrapolation of measured values to surface<br />
areas<br />
Percentage of sealed (artificial) area per grid<br />
cell<br />
EEA data service (EEA, 2010b)<br />
• very high assets: average > 1.5 standard<br />
deviations: score = 15<br />
The input data are classified according to their<br />
inherent differences, without a subjective rating<br />
of 'good' or 'bad'. For example, areas in northern<br />
Scandinavia with a low proportion of farmland also<br />
score low with regard to HNV farmland, but this<br />
does not mean that these areas have few natural<br />
assets.<br />
Maps 10.2 and 10.3 present the natural and<br />
environmental assets for the EU‐27, and mountain<br />
massifs within these countries, respectively. Even<br />
in Map 10.2 it can be seen that mountain massifs<br />
generally stand out; but it should also be noted<br />
that there are significant areas with high levels of<br />
natural and environmental assets in other parts of<br />
the EU‐27, including much of Sweden, Finland and<br />
Estonia.<br />
Table 10.5 permits a comparison of the relative<br />
proportions of natural and environmental assets<br />
across the massifs, though considering only the parts<br />
within EU Member States. As can be seen in column 2<br />
(data for class 0), large areas in the Nordic mountains<br />
(Norway) and the Balkans/South-east Europe are<br />
not considered and are not discussed further below;<br />
no results are shown for Turkey. The massifs that<br />
have very high assets (class 5) over particularly high<br />
proportions of their area are those of the British<br />
Isles (59 %), western Mediterranean islands (25 %)<br />
and Iberian mountains (22 %). Many more massifs<br />
have high assets (class 4) over particularly high<br />
proportions of their area: Pyrenees (44 %), Iberian<br />
mountains (31 %), Alps (29 %), French/Swiss middle<br />
Table 10.4 Thresholds for the definition of classes of natural and environmental assets<br />
Class 1 2 3 4 5<br />
Asset level Very low Low Average High Very high<br />
Score 1 3 6 10 15<br />
Rural typologies Urban Peri-urban – Rural Deep rural<br />
High Nature Value<br />
0 0–25 25–50 50–75 75–100<br />
farmland (%)<br />
Proximity to<br />
0–4 4–34 34–65 65–95 95–100<br />
natural areas (%)<br />
Air quality (PM 10<br />
> 56 50–64 30–49 20–29 0–19<br />
emissions, µg/m 3 )<br />
Degree of soil<br />
sealing (%)<br />
51–100 37–51 23–37 9–23 0–9<br />
Europe's <strong>ecological</strong> <strong>backbone</strong>: recognising the true value of our mountains<br />
191