Europes ecological backbone.pdf
Europes ecological backbone.pdf
Europes ecological backbone.pdf

You also want an ePaper? Increase the reach of your titles
YUMPU automatically turns print PDFs into web optimized ePapers that Google loves.
Land cover and uses<br />
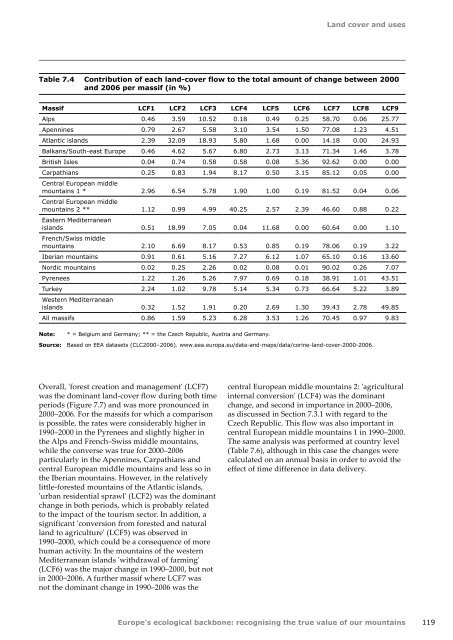
Table 7.4 Contribution of each land‐cover flow to the total amount of change between 2000<br />
and 2006 per massif (in %)<br />
Massif LCF1 LCF2 LCF3 LCF4 LCF5 LCF6 LCF7 LCF8 LCF9<br />
Alps 0.46 3.59 10.52 0.18 0.49 0.25 58.70 0.06 25.77<br />
Apennines 0.79 2.67 5.58 3.10 3.54 1.50 77.08 1.23 4.51<br />
Atlantic islands 2.39 32.09 18.93 5.80 1.68 0.00 14.18 0.00 24.93<br />
Balkans/South-east Europe 0.46 4.62 5.67 6.80 2.73 3.13 71.34 1.46 3.78<br />
British Isles 0.04 0.74 0.58 0.58 0.08 5.36 92.62 0.00 0.00<br />
Carpathians 0.25 0.83 1.94 8.17 0.50 3.15 85.12 0.05 0.00<br />
Central European middle<br />
mountains 1 * 2.96 6.54 5.78 1.90 1.00 0.19 81.52 0.04 0.06<br />
Central European middle<br />
mountains 2 ** 1.12 0.99 4.99 40.25 2.57 2.39 46.60 0.88 0.22<br />
Eastern Mediterranean<br />
islands 0.51 18.99 7.05 0.04 11.68 0.00 60.64 0.00 1.10<br />
French/Swiss middle<br />
mountains 2.10 6.69 8.17 0.53 0.85 0.19 78.06 0.19 3.22<br />
Iberian mountains 0.91 0.61 5.16 7.27 6.12 1.07 65.10 0.16 13.60<br />
Nordic mountains 0.02 0.25 2.26 0.02 0.08 0.01 90.02 0.26 7.07<br />
Pyrenees 1.22 1.26 5.26 7.97 0.69 0.18 38.91 1.01 43.51<br />
Turkey 2.24 1.02 9.78 5.14 5.34 0.73 66.64 5.22 3.89<br />
Western Mediterranean<br />
islands 0.32 1.52 1.91 0.20 2.69 1.30 39.43 2.78 49.85<br />
All massifs 0.86 1.59 5.23 6.28 3.53 1.26 70.45 0.97 9.83<br />
Note:<br />
* = Belgium and Germany; ** = the Czech Republic, Austria and Germany.<br />
Source: Based on EEA datasets (CLC2000–2006). www.eea.europa.eu/data-and-maps/data/corine-land-cover-2000-2006.<br />
Overall, 'forest creation and management' (LCF7)<br />
was the dominant land‐cover flow during both time<br />
periods (Figure 7.7) and was more pronounced in<br />
2000–2006. For the massifs for which a comparison<br />
is possible, the rates were considerably higher in<br />
1990–2000 in the Pyrenees and slightly higher in<br />
the Alps and French–Swiss middle mountains,<br />
while the converse was true for 2000–2006<br />
particularly in the Apennines, Carpathians and<br />
central European middle mountains and less so in<br />
the Iberian mountains. However, in the relatively<br />
little-forested mountains of the Atlantic islands,<br />
'urban residential sprawl' (LCF2) was the dominant<br />
change in both periods, which is probably related<br />
to the impact of the tourism sector. In addition, a<br />
significant 'conversion from forested and natural<br />
land to agriculture' (LCF5) was observed in<br />
1990–2000, which could be a consequence of more<br />
human activity. In the mountains of the western<br />
Mediterranean islands 'withdrawal of farming'<br />
(LCF6) was the major change in 1990–2000, but not<br />
in 2000–2006. A further massif where LCF7 was<br />
not the dominant change in 1990–2006 was the<br />
central European middle mountains 2: 'agricultural<br />
internal conversion' (LCF4) was the dominant<br />
change, and second in importance in 2000–2006,<br />
as discussed in Section 7.3.1 with regard to the<br />
Czech Republic. This flow was also important in<br />
central European middle mountains 1 in 1990–2000.<br />
The same analysis was performed at country level<br />
(Table 7.6), although in this case the changes were<br />
calculated on an annual basis in order to avoid the<br />
effect of time difference in data delivery.<br />
Europe's <strong>ecological</strong> <strong>backbone</strong>: recognising the true value of our mountains<br />
119