- Page 1 and 2:
PSERC Control and Design of Microgr
- Page 3 and 4:
Information about this project For
- Page 5 and 6:
Executive Summary Economic, technol
- Page 7 and 8: Table of Contents Chapter 1. Introd
- Page 9 and 10: List of Figures Figure 1.1 Microgri
- Page 11 and 12: List of Figures (continued) Figure
- Page 13 and 14: Chapter 1. Introduction Distributed
- Page 15 and 16: 1.2.2 Operation and Investment The
- Page 17 and 18: Figure 1.1 Microgrid Architecture D
- Page 19 and 20: Chapter 2. Static Switch The static
- Page 21 and 22: ω ωo ω1 Preq Pgrid P Pload Figur
- Page 23 and 24: 2.3 Synchronization Conditions The
- Page 25 and 26: droop. The issue is that it is poss
- Page 27 and 28: This synchronizing behavior is unac
- Page 29 and 30: Figure 2.12 shows on the upper plot
- Page 31 and 32: Chapter 3. Microsource Details This
- Page 33 and 34: with different size. This control i
- Page 35 and 36: u + _ K F ω o + _ ω o s P u ω o
- Page 37 and 38: Q versus E Droop E req Q m Q _ + E
- Page 39 and 40: currents from the microsources incr
- Page 41 and 42: inverter ratings limits (in kVA) ca
- Page 43 and 44: A 16 DG B 22 DG Static Switch C 8 D
- Page 45 and 46: ω Unit 2 Max Unit 2 ω o Unit 1 ω
- Page 47 and 48: Unit 1 Min Unit 2 ω Unit 1 ΔPmin
- Page 49 and 50: positive value. When this value has
- Page 51 and 52: needs of power. This solution would
- Page 53 and 54: This expression is very similar to
- Page 55 and 56: Li-Pmax < Fi < Li for unit ‘i’
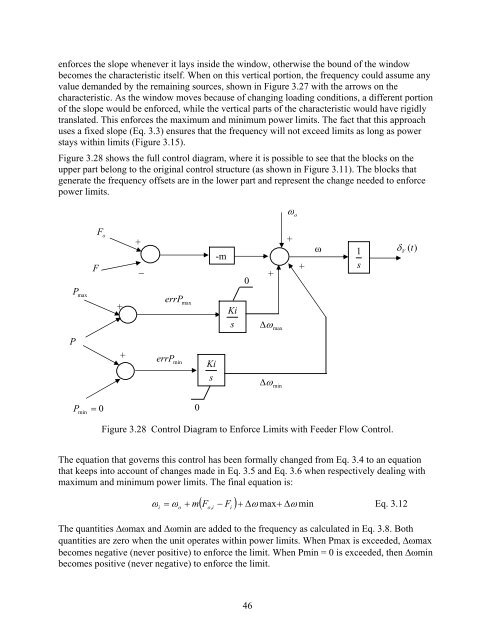
- Page 57: ω ω ω o Fo ω o Fo F F Unit Powe
- Page 61 and 62: characteristic will coincide with t
- Page 63 and 64: ating on the voltage output, establ
- Page 65 and 66: Prime Mover DC Storage Voltage Sour
- Page 67 and 68: linearity. A value of 30 degrees pr
- Page 69 and 70: Figure 4.8 P and Q Plane Capability
- Page 71 and 72: 4.4 System Ratings The inverter per
- Page 73 and 74: Switching Sequence 145 146 136 236
- Page 75 and 76: generated by the inverter: the VA r
- Page 77 and 78: % of voltage unbalance = 100 maximu
- Page 79 and 80: Figure 5.2 shows the plots for P,Q
- Page 81 and 82: Figure 5.5 shows the measures of P
- Page 83 and 84: Figure 5.7 One Unit Connected to th
- Page 85 and 86: Microsources are connected to the l
- Page 87 and 88: The transformer impedance can be se
- Page 89 and 90: o r 1 = 0.3277 Ω = 0.0547 Ω x x 1
- Page 91 and 92: Table 6.3 Load Data Summary. Rated
- Page 93 and 94: The worse case scenario is represen
- Page 95 and 96: The filtering is achieved by a low
- Page 97 and 98: works with an internal voltage leve
- Page 99 and 100: terminals to achieve each of the th
- Page 101 and 102: Table 6.5 Lookup Table for Switchin
- Page 103 and 104: Chapter 7. Microgrid Tests There ar
- Page 105 and 106: Table 7.1 Summary of Experiments fo
- Page 107 and 108: Table 7.2 Series Configuration Cont
- Page 109 and 110:
Figure 7.6 Control of F1 and F2, Fe
- Page 111 and 112:
Figure 7.10 Control of P1 and F2, F
- Page 113 and 114:
pu, but when it is fed from a remot
- Page 115 and 116:
Unit 1: P, Q, F, Frequency, Voltage
- Page 117 and 118:
Unit 1: P, Q, F, Frequency, Voltage
- Page 119 and 120:
Unit 1: P, Q, F, Frequency, Voltage
- Page 121 and 122:
Unit 1: P, Q, F, Frequency, Voltage
- Page 123 and 124:
Unit 1: P, Q, F, Frequency, Voltage
- Page 125 and 126:
Unit 1: P, Q, F, Frequency, Voltage
- Page 127 and 128:
Unit 1: P, Q, F, Frequency, Voltage
- Page 129 and 130:
Unit 1: P, Q, F, Frequency, Voltage
- Page 131 and 132:
Unit 1: P, Q, F, Frequency, Voltage
- Page 133 and 134:
Unit 1: P, Q, F, Frequency, Voltage
- Page 135 and 136:
Unit 1: P, Q, F, Frequency, Voltage
- Page 137 and 138:
Unit 1: P, Q, F, Frequency, Voltage
- Page 139 and 140:
Unit 1: P, Q, F, Frequency, Voltage
- Page 141 and 142:
Unit 1: P, Q, F, Frequency, Voltage
- Page 143 and 144:
Unit 1: P, Q, F, Frequency, Voltage
- Page 145 and 146:
Unit 1: P, Q, F, Frequency, Voltage
- Page 147 and 148:
Unit 1: P, Q, F, Frequency, Voltage
- Page 149 and 150:
Unit 1: P, Q, F, Frequency, Voltage
- Page 151 and 152:
Unit 1: P, Q, F, Frequency, Voltage
- Page 153 and 154:
Unit 1: P, Q, F, Frequency, Voltage
- Page 155 and 156:
Unit 1: P, Q, F, Frequency, Voltage
- Page 157 and 158:
Unit 1: P, Q, F, Frequency, Voltage
- Page 159 and 160:
Unit 1: P, Q, F, Frequency, Voltage
- Page 161 and 162:
Unit 1: P, Q, F, Frequency, Voltage
- Page 163 and 164:
Unit 1: P, Q, F, Frequency, Voltage
- Page 165 and 166:
Unit 1: P, Q, F, Frequency, Voltage
- Page 167 and 168:
Unit 1: P, Q, F, Frequency, Voltage
- Page 169 and 170:
Unit 1: P, Q, F, Frequency, Voltage
- Page 171 and 172:
Unit 1: P, Q, F, Frequency, Voltage
- Page 173 and 174:
Unit 1: P, Q, F, Frequency, Voltage
- Page 175 and 176:
Unit 1: P, Q, F, Frequency, Voltage
- Page 177 and 178:
Unit 1: P, Q, F, Frequency, Voltage
- Page 179 and 180:
Unit 1: P, Q, F, Frequency, Voltage
- Page 181 and 182:
Unit 1: P, Q, F, Frequency, Voltage
- Page 183 and 184:
Unit 1: P, Q, F, Frequency, Voltage
- Page 185 and 186:
Unit 1: P, Q, F, Frequency, Voltage
- Page 187 and 188:
Unit 1: P, Q, F, Frequency, Voltage
- Page 189 and 190:
Unit 1: P, Q, F, Frequency, Voltage
- Page 191 and 192:
Unit 1: P, Q, F, Frequency, Voltage
- Page 193 and 194:
Unit 1: P, Q, F, Frequency, Voltage
- Page 195 and 196:
Unit 1: P, Q, F, Frequency, Voltage
- Page 197 and 198:
Unit 1: P, Q, F, Frequency, Voltage
- Page 199 and 200:
Unit 1: P, Q, F, Frequency, Voltage
- Page 201 and 202:
Unit 1: P, Q, F, Frequency, Voltage
- Page 203 and 204:
Unit 1: P, Q, F, Frequency, Voltage
- Page 205 and 206:
Unit 1: P, Q, F, Frequency, Voltage
- Page 207 and 208:
7.4.1 Unit 1 (F), Unit 2 (F), Impor
- Page 209 and 210:
Import From Grid, Setpoints are 10%
- Page 211 and 212:
Import From Grid, Setpoints are 10%
- Page 213 and 214:
Island, Setpoints are 10% and 90% o
- Page 215 and 216:
Island, Setpoints are 10% and 90% o
- Page 217 and 218:
Import From Grid, Setpoints are 90%
- Page 219 and 220:
Import From Grid, Setpoints are 90%
- Page 221 and 222:
7.4.2 Unit 1 (F), Unit 2 (F), Expor
- Page 223 and 224:
Export to Grid, Setpoints are 10% a
- Page 225 and 226:
Export to Grid, Setpoints are 90% a
- Page 227 and 228:
Island, Setpoints are 90% and 10% o
- Page 229 and 230:
Island, Setpoints are 90% and 10% o
- Page 231 and 232:
7.4.3 Unit 1 (F), Unit 2 (P), Impor
- Page 233 and 234:
Import From Grid, Setpoints are 10%
- Page 235 and 236:
Import From Grid, Setpoints are 10%
- Page 237 and 238:
Island, Setpoints are 10% and 90% o
- Page 239 and 240:
Island, Setpoints are 10% and 90% o
- Page 241 and 242:
Import From Grid, Setpoints are 90%
- Page 243 and 244:
Import From Grid, Setpoints are 90%
- Page 245 and 246:
7.4.4 Unit 1 (F), Unit 2 (P), Expor
- Page 247 and 248:
Export to Grid, Setpoints are 10% a
- Page 249 and 250:
Export to Grid, Setpoints are 90% a
- Page 251 and 252:
Island, Setpoints are 90% and 10% o
- Page 253 and 254:
Island, Setpoints are 90% and 10% o
- Page 255 and 256:
Chapter 8. Conclusions This work sh
- Page 257:
[14] Lasseter, R.,” Microgrids,