

Scania annual report 2002
Scania annual report 2002
Scania annual report 2002

You also want an ePaper? Increase the reach of your titles
YUMPU automatically turns print PDFs into web optimized ePapers that Google loves.
For further information: www.scania.com<br />
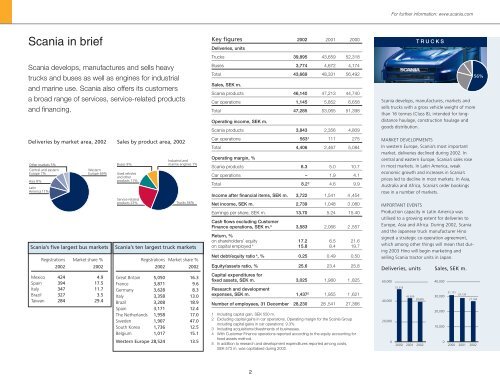
<strong>Scania</strong> in brief<br />
<strong>Scania</strong> develops, manufactures and sells heavy<br />
trucks and buses as well as engines for industrial<br />
and marine use. <strong>Scania</strong> also offers its customers<br />
a broad range of services, service-related products<br />
and financing.<br />
Deliveries by market area, <strong>2002</strong> Sales by product area, <strong>2002</strong><br />
Other markets 5%<br />
Central and eastern<br />
Europe 7%<br />
Asia 8%<br />
Latin<br />
America11%<br />
Western<br />
Europe 69%<br />
<strong>Scania</strong>’s five largest bus markets<br />
Registrations Market share %<br />
<strong>2002</strong> <strong>2002</strong><br />
Mexico 424 4.9<br />
Spain 394 17.5<br />
Italy 347 11.7<br />
Brazil 327 3.5<br />
Taiwan 284 29.4<br />
Buses 9%<br />
Used vehicles<br />
and other<br />
products 11%<br />
Service-related<br />
products 23%<br />
Industrial and<br />
marine engines 1%<br />
Trucks 56%<br />
<strong>Scania</strong>’s ten largest truck markets<br />
Registrations Market share %<br />
<strong>2002</strong> <strong>2002</strong><br />
Great Britain 5,050 16.3<br />
France 3,871 9.6<br />
Germany 3,628 8.3<br />
Italy 3,358 13.0<br />
Brazil 3,208 18.9<br />
Spain 3,171 12.4<br />
The Netherlands 1,958 17.0<br />
Sweden 1,907 47.0<br />
South Korea 1,736 12.5<br />
Belgium 1,017 15.1<br />
Western Europe 28,524 13.5<br />
Key figures <strong>2002</strong> 2001 2000<br />
Deliveries, units<br />
Trucks 39,895 43,659 52,318<br />
Buses 3,774 4,672 4,174<br />
Total 43,669 48,331 56,492<br />
Sales, SEK m.<br />
<strong>Scania</strong> products 46,140 47,213 44,740<br />
Car operations 1,145 5,852 6,658<br />
Total 47,285 53,065 51,398<br />
Operating income, SEK m.<br />
<strong>Scania</strong> products 3,843 2,356 4,809<br />
Car operations 563 1 111 275<br />
Total 4,406 2,467 5,084<br />
Operating margin, %<br />
<strong>Scania</strong> products 8.3 5.0 10.7<br />
Car operations – 1.9 4.1<br />
Total 8.2 2 4.6 9.9<br />
Income after financial items, SEK m. 3,722 1,541 4 ,454<br />
Net income, SEK m. 2,739 1,048 3 ,080<br />
Earnings per share, SEK m. 13.70 5.24 15.40<br />
Cash flows excluding Customer<br />
Finance operations, SEK m. 3 3,583 2,066 2 ,557<br />
Return, %<br />
on shareholders’ equity 17.2 6.5 21.6<br />
on capital employed 4 15.8 8.4 19.7<br />
Net debt/equity ratio 4 , % 0.25 0.49 0.50<br />
Equity/assets ratio, % 25.6 23.4 25.8<br />
Capital expenditures for<br />
fixed assets, SEK m. 3,025 1,980 1 ,825<br />
Research and development<br />
expenses, SEK m. 1,437 5 1,955 1 ,621<br />
Number of employees, 31 December 28,230 28 ,541 27,366<br />
1 Including capital gain, SEK 550 m.<br />
2 Excluding capital gains in car operations. Operating margin for the <strong>Scania</strong> Group<br />
including capital gains in car operations: 9.3%.<br />
3 Including acquisitions/divestments of businesses.<br />
4 With Customer Finance operations <strong>report</strong>ed according to the equity accounting for<br />
fixed assets method.<br />
5 In addition to research and development expenditures <strong>report</strong>ed among costs,<br />
SEK 573 m. was capitalised during <strong>2002</strong>.<br />
<strong>Scania</strong> develops, manufactures, markets and<br />
sells trucks with a gross vehicle weight of more<br />
than 16 tonnes (Class 8), intended for longdistance<br />
haulage, construction haulage and<br />
goods distribution.<br />
MARKET DEVELOPMENTS<br />
In western Europe, <strong>Scania</strong>’s most important<br />
market, deliveries declined during <strong>2002</strong>. In<br />
central and eastern Europe, <strong>Scania</strong>’s sales rose<br />
in most markets. In Latin America, weak<br />
economic growth and increases in <strong>Scania</strong>’s<br />
prices led to decline in most markets. In Asia,<br />
Australia and Africa, <strong>Scania</strong>’s order bookings<br />
rose in a number of markets.<br />
IMPORTANT EVENTS<br />
Production capacity in Latin America was<br />
utilised to a growing extent for deliveries to<br />
Europe, Asia and Africa. During <strong>2002</strong>, <strong>Scania</strong><br />
and the Japanese truck manufacturer Hino<br />
signed a strategic co-operation agreement,<br />
which among other things will mean that during<br />
2003 Hino will begin marketing and<br />
selling <strong>Scania</strong> tractor units in Japan.<br />
Deliveries, units<br />
60,000<br />
40,000<br />
20,000<br />
0<br />
52,318<br />
43,659<br />
2000 2001 <strong>2002</strong><br />
TRUCKS<br />
39,895<br />
Sales, SEK m.<br />
40,000<br />
30,000<br />
20,000<br />
10,000<br />
0<br />
31,101<br />
29,139<br />
27,184<br />
2000 2001 <strong>2002</strong><br />
56%<br />
2


