Scania annual report 2002
Scania annual report 2002
Scania annual report 2002

Create successful ePaper yourself
Turn your PDF publications into a flip-book with our unique Google optimized e-Paper software.
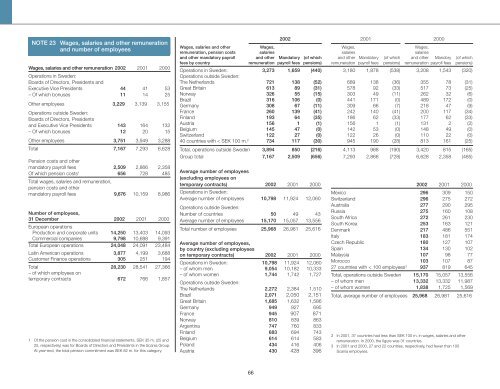
NOTE 23 Wages, salaries and other remuneration<br />
and number of employees<br />
Wages, salaries and other remuneration <strong>2002</strong> 2001 2000<br />
Operations in Sweden:<br />
Boards of Directors, Presidents and<br />
Executive Vice Presidents 44 41 53<br />
– Of which bonuses 11 14 25<br />
Other employees 3,229 3,139 3,155<br />
Operations outside Sweden:<br />
Boards of Directors, Presidents<br />
and Executive Vice Presidents 143 164 132<br />
– Of which bonuses 12 20 15<br />
Other employees 3,751 3,949 3,288<br />
Total 7,167 7,293 6,628<br />
Pension costs and other<br />
mandatory payroll fees 2,509 2,866 2,358<br />
Of which pension costs 1 656 728 485<br />
Total wages, salaries and remuneration,<br />
pension costs and other<br />
mandatory payroll fees 9,676 10,159 8,986<br />
Number of employees,<br />
31 December <strong>2002</strong> 2001 2000<br />
European operations<br />
Production and corporate units 14,250 13,403 14,093<br />
Commercial companies 9,798 10,688 9,391<br />
Total European operations 24,048 24,091 23,484<br />
Latin American operations 3,877 4,199 3,688<br />
Customer Finance operations 305 251 194<br />
Total 28,230 28,541 27,366<br />
– of which employees on<br />
temporary contracts 672 766 1,857<br />
1 Of the pension cost in the consolidated financial statements, SEK 35 m. (25 and<br />
25, respectively) was for Boards of Directors and Presidents in the <strong>Scania</strong> Group.<br />
At year-end, the total pension commitment was SEK 82 m. for this category.<br />
<strong>2002</strong> 2001 2000<br />
Wages, salaries and other Wages, Wages, Wages,<br />
remuneration, pension costs salaries salaries salaries<br />
and other mandatory payroll and other Mandatory (of which and other Mandatory (of which and other Mandory (of which<br />
fees by country remuneration payroll fees pensions) remuneration payroll fees pensions) remuneration payroll fees pensions)<br />
Operations in Sweden: 3,273 1,659 (440) 3,180 1,878 (538) 3,208 1,543 (320)<br />
Operations outside Sweden:<br />
The Netherlands 721 138 (52) 689 138 (36) 355 78 (31)<br />
Great Britain 613 89 (31) 578 92 (33) 517 73 (25)<br />
Norway 326 55 (15) 303 49 (11) 262 32 (6)<br />
Brazil 316 106 (0) 441 171 (0) 489 172 (0)<br />
Germany 308 67 (11) 309 66 (7) 218 47 (9)<br />
France 260 139 (41) 242 140 (41) 200 117 (34)<br />
Finland 193 64 (35) 186 62 (33) 177 62 (33)<br />
Austria 156 1 (1) 156 1 (1) 131 2 (2)<br />
Belgium 145 47 (0) 142 53 (0) 148 49 (0)<br />
Switzerland 122 27 (0) 122 26 (0) 110 22 (0)<br />
40 countries with < SEK 100 m. 2 734 117 (30) 945 190 (28) 813 161 (25)<br />
Total, operations outside Sweden 3,894 850 (216) 4,113 988 (190) 3,420 815 (165)<br />
Group total 7,167 2,509 (656) 7,293 2,866 (728) 6,628 2,358 (485)<br />
Average number of employees<br />
(excluding employees on<br />
temporary contracts) <strong>2002</strong> 2001 2000<br />
Operations in Sweden:<br />
Average number of employees 10,798 11,924 12,060<br />
Operations outside Sweden:<br />
Number of countries 50 49 43<br />
Average number of employees 15,170 15,057 13,556<br />
Total number of employees 25,968 26,981 25,616<br />
Average number of employees,<br />
by country (excluding employees<br />
on temporary contracts) <strong>2002</strong> 2001 2000<br />
Operations in Sweden: 10,798 11,924 12,060<br />
– of whom men 9,054 10,182 10,333<br />
– of whom women 1,744 1,742 1,727<br />
Operations outside Sweden:<br />
The Netherlands 2,272 2,384 1,510<br />
Brazil 2,071 2,050 2,151<br />
Great Britain 1,685 1,632 1,586<br />
Germany 949 927 695<br />
France 945 907 871<br />
Norway 810 839 863<br />
Argentina 747 760 833<br />
Finland 683 694 743<br />
Belgium 614 614 583<br />
Poland 434 416 406<br />
Austria 430 428 396<br />
<strong>2002</strong> 2001 2000<br />
Mexico 296 309 150<br />
Switzerland 296 275 272<br />
Australia 277 290 295<br />
Russia 275 160 108<br />
South Africa 272 261 230<br />
South Korea 253 163 121<br />
Denmark 217 486 551<br />
Italy 183 181 174<br />
Czech Republic 180 127 107<br />
Spain 134 130 102<br />
Malaysia 107 98 77<br />
Morocco 103 107 87<br />
27 countries with < 100 employees 3 937 819 645<br />
Total, operations outside Sweden 15,170 15,057 13,556<br />
– of whom men 13,332 13,332 11,987<br />
– of whom women 1,838 1,725 1,569<br />
Total, average number of employees 25,968 26,981 25,616<br />
2 In 2001, 37 countries had less than SEK 100 m. in wages, salaries and other<br />
remuneration. In 2000, the figure was 31 countries.<br />
3 In 2001 and 2000, 27 and 22 countries, respectively, had fewer than 100<br />
<strong>Scania</strong> employees.<br />
66