

Scania annual report 2002
Scania annual report 2002
Scania annual report 2002

Create successful ePaper yourself
Turn your PDF publications into a flip-book with our unique Google optimized e-Paper software.
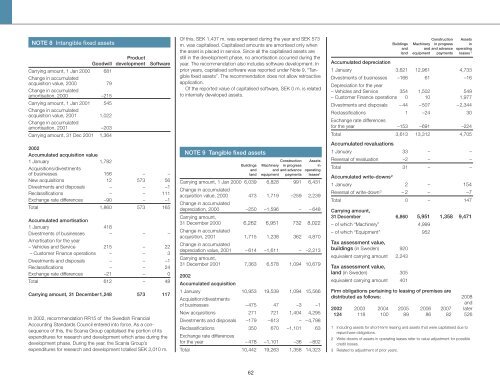
NOTE 8 Intangible fixed assets<br />
Product<br />
Goodwill development<br />
Carrying amount, 1 Jan 2000 681<br />
Change in accumulated<br />
acquisition value, 2000 79<br />
Change in accumulated<br />
amortisation, 2000 –215<br />
Carrying amount, 1 Jan 2001 545<br />
Change in accumulated<br />
acquisition value, 2001 1,022<br />
Change in accumulated<br />
amortisation, 2001 –203<br />
Carrying amount, 31 Dec 2001 1,364<br />
Software<br />
<strong>2002</strong><br />
Accumulated acquisition value<br />
1 January 1,782<br />
Acquisitions/divestments<br />
of businesses 156 – –<br />
New acquisitions 12 573 56<br />
Divestments and disposals – – –1<br />
Reclassifications – – 111<br />
Exchange rate differences –90 – –1<br />
Total 1,860 573 165<br />
Accumulated amortisation<br />
1 January 418<br />
Divestments of businesses – – –<br />
Amortisation for the year<br />
– Vehicles and Service 215 – 22<br />
– Customer Finance operations – – 3<br />
Divestments and disposals – – –1<br />
Reclassifications – – 24<br />
Exchange rate differences –21 – 0<br />
Total 612 – 48<br />
Carrying amount, 31 December1,248 573 117<br />
In <strong>2002</strong>, recommendation RR15 of the Swedish Financial<br />
Accounting Standards Council entered into force. As a consequence<br />
of this, the <strong>Scania</strong> Group capitalised the portion of its<br />
expenditures for research and development which arise during the<br />
development phase. During the year, the <strong>Scania</strong> Group’s<br />
expenditures for research and development totalled SEK 2,010 m.<br />
Of this, SEK 1,437 m. was expensed during the year and SEK 573<br />
m. was capitalised. Capitalised amounts are amortised only when<br />
the asset is placed in service. Since all the capitalised assets are<br />
still in the development phase, no amortisation occurred during the<br />
year. The recommendation also includes software development. In<br />
prior years, capitalised software was <strong>report</strong>ed under Note 9, “Tangible<br />
fixed assets”. The recommendation does not allow retroactive<br />
application.<br />
Of the <strong>report</strong>ed value of capitalised software, SEK 0 m. is related<br />
to internally developed assets.<br />
NOTE 9 Tangible fixed assets<br />
Construction Assets<br />
Buildings Machinery in progress in<br />
and and and advance operating<br />
land equipment payments leases 1<br />
Carrying amount, 1 Jan 2000 6,039 6,828 991 6,431<br />
Change in accumulated<br />
acquisition value, 2000 473 1,719 –259 2,239<br />
Change in accumulated<br />
depreciation, 2000 –250 –1,596 – – 648<br />
Carrying amount,<br />
31 December 2000 6,262 6,951 732 8,022<br />
Change in accumulated<br />
acquisition, 2001 1,715 1,238 362 4,870<br />
Change in accumulated<br />
depreciation value, 2001 – 614 –1,611 – –2,213<br />
Carrying amount,<br />
31 December 2001 7,363 6,578 1,094 10,679<br />
<strong>2002</strong><br />
Accumulated acquisition<br />
1 January 10,953 19,539 1,094 15,566<br />
Acquisition/divestments<br />
of businesses –475 47 –3 –1<br />
New acquisitions 271 721 1,404 4,295<br />
Divestments and disposals –179 –613 – –4,798<br />
Reclassifications 350 670 –1,101 63<br />
Exchange rate differences<br />
for the year – 478 –1,101 –36 –802<br />
Total 10,442 19,263 1,358 14,323<br />
Construction Assets<br />
Buildings Machinery in progress in<br />
and and and advance operating<br />
land equipment payments leases 1<br />
Accumulated depreciation<br />
1 January 3,621 12,961 4,733<br />
Divestments of businesses –166 61 –16<br />
Depreciation for the year<br />
– Vehicles and Service 354 1,502 549<br />
– Customer Finance operations 0 10 1,977<br />
Divestments and disposals – 44 –507 –2,344<br />
Reclassifications 1 –24 30<br />
Exchange rate differences<br />
for the year –153 –691 –224<br />
Total 3,613 13,312 4,705<br />
Accumulated revaluations<br />
1 January 33 – –<br />
Reversal of revaluation –2 – –<br />
Total 31 – –<br />
Accumulated write-downs 2<br />
1 January 2 – 154<br />
Reversal of write-down 3 –2 – –7<br />
Total 0 – 147<br />
Carrying amount,<br />
31 December 6,860 5,951 1,358 9,471<br />
– of which “Machinery” 4,999<br />
– of which “Equipment” 952<br />
Tax assessment value,<br />
buildings (in Sweden) 920<br />
equivalent carrying amount 2,243<br />
Tax assessment value,<br />
land (in Sweden) 305<br />
equivalent carrying amount 401<br />
Firm obligations pertaining to leasing of premises are<br />
distributed as follows: 2008<br />
and<br />
<strong>2002</strong> 2003 2004 2005 2006 2007 later<br />
124 118 100 89 86 82 526<br />
1 Including assets for short-term leasing and assets that were capitalised due to<br />
repurchase obligations.<br />
2 Write-downs of assets in operating leases refer to value adjustment for possible<br />
credit losses.<br />
3 Related to adjustment of prior years.<br />
62


