Scania annual report 2002
Scania annual report 2002
Scania annual report 2002

Create successful ePaper yourself
Turn your PDF publications into a flip-book with our unique Google optimized e-Paper software.
NOTES<br />
THE GROUP<br />
Note 1 Sales page 59<br />
Note 2 Customer Finance operations 59<br />
Note 3 Share of income of associated companies 60<br />
Note 4 Divested operations 60<br />
Note 5 Financial income and expenses 60<br />
Note 6 Taxes 61<br />
Note 7 Depreciation/amortisation 61<br />
Note 8 Intangible fixed assets 62<br />
Note 9 Tangible fixed assets 62<br />
Note 10 Holdings in associated companies etc 63<br />
Note 11 Interest-bearing receivables (long-term) 63<br />
Note 12 Inventories 63<br />
Note 13 Receivables (current) 63<br />
Note 14 Short-term investments 63<br />
Note 15 Shareholders’ equity 63<br />
Note 16 Provisions for pensions and similar commitments 64<br />
Note 17 Other provisions 64<br />
Note 18 Borrowings 64<br />
Note 19 Accrued expenses and prepaid income 65<br />
Note 20 Assets pledged 65<br />
Note 21 Contingent liabilities 65<br />
Note 22 Cash flow statement 65<br />
Note 23 Wages, salaries and other remuneration and<br />
number of employees 66<br />
Note 24 Information regarding compensation to<br />
executive officers and auditors 67<br />
Note 25 Net assets outside Sweden 68<br />
Note 26 Currency exposure in operating income 68<br />
Note 27 Effect of exchange rate differences on<br />
net income 68<br />
THE PARENT COMPANY<br />
Note 1 Financial income and expenses 69<br />
Note 2 Taxes 69<br />
Note 3 Shares in Group companies 69<br />
Note 4 Shareholders’ equity 69<br />
Note 5 Untaxed reserves 69<br />
Note 6 Contingent liabilities 69<br />
Note 7 Information regarding compensation to<br />
executive officers and auditors 69<br />
All amounts are stated in millions of Swedish kronor<br />
(SEK m.) unless otherwise indicated<br />
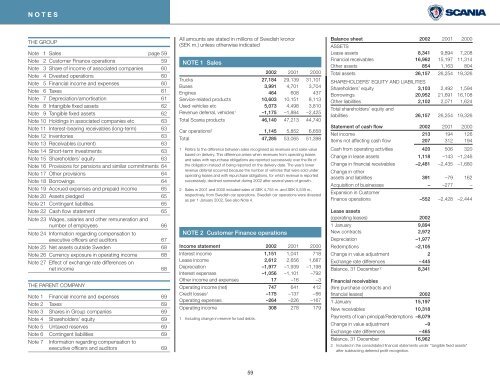
NOTE 1 Sales<br />
<strong>2002</strong> 2001 2000<br />
Trucks 27,184 29,139 31,101<br />
Buses 3,991 4,701 3,704<br />
Engines 464 608 437<br />
Service-related products 10,603 10,151 8,113<br />
Used vehicles etc 5,073 4,498 3,810<br />
Revenue deferral, vehicles 1 –1,175 –1,884 –2,425<br />
Total <strong>Scania</strong> products 46,140 47,213 44,740<br />
Car operations 2 1,145 5,852 6,658<br />
Total 47,285 53,065 51,398<br />
1 Refers to the difference between sales recognised as revenues and sales value<br />
based on delivery. This difference arises when revenues from operating leases<br />
and sales with repurchase obligations are <strong>report</strong>ed successively over the life of<br />
the obligation instead of being <strong>report</strong>ed on the delivery date. The year’s lower<br />
revenue deferral occurred because the number of vehicles that were sold under<br />
operating leases and with repurchase obligations, for which revenue is <strong>report</strong>ed<br />
successively, declined somewhat during <strong>2002</strong> after several years of growth.<br />
2 Sales in 2001 and 2000 included sales of SEK 4,755 m. and SEK 5,539 m.,<br />
respectively, from Swedish car operations. Swedish car operations were divested<br />
as per 1 January <strong>2002</strong>, See also Note 4.<br />
NOTE 2 Customer Finance operations<br />
Income statement <strong>2002</strong> 2001 2000<br />
Interest income 1,151 1,041 718<br />
Lease income 2,612 2,656 1,687<br />
Depreciation –1,977 –1,939 –1,198<br />
Interest expenses –1,056 –1,101 –792<br />
Other income and expenses 17 –16 –3<br />
Operating income (net) 747 641 412<br />
Credit losses 1 –175 –137 –66<br />
Operating expenses –264 –226 –167<br />
Operating income 308 278 179<br />
1 Including change in reserve for bad debts.<br />
Balance sheet <strong>2002</strong> 2001 2000<br />
ASSETS<br />
Lease assets 8,341 9,894 7,208<br />
Financial receivables 16,962 15,197 11,314<br />
Other assets 854 1,163 804<br />
Total assets 26,157 26,254 19,326<br />
SHAREHOLDERS’ EQUITY AND LIABILITIES<br />
Shareholders’ equity 3,103 2,492 1,594<br />
Borrowings 20,952 21,691 16,108<br />
Other liabilities 2,102 2,071 1,624<br />
Total shareholders’ equity and<br />
liabilities 26,157 26,254 19,326<br />
Statement of cash flow <strong>2002</strong> 2001 2000<br />
Net income 213 194 126<br />
Items not affecting cash flow 207 312 194<br />
Cash from operating activities 420 506 320<br />
Change in lease assets 1,118 –143 –1,246<br />
Change in financial receivables –2,481 –2,435 –1,680<br />
Change in other<br />
assets and liabilities 391 –79 162<br />
Acquisition of businesses – –277 –<br />
Expansion in Customer<br />
Finance operations –552 –2,428 –2,444<br />
Lease assets<br />
(operating leases) <strong>2002</strong><br />
1 January 9,894<br />
New contracts 2,972<br />
Depreciation –1,977<br />
Redemptions –2,105<br />
Change in value adjustment 2<br />
Exchange rate differences –445<br />
Balance, 31 December 2 8,341<br />
Financial receivables<br />
(hire purchase contracts and<br />
financial leases) <strong>2002</strong><br />
1 January 15,197<br />
New receivables 10,318<br />
Payments of loan principal/Redemptions –8,079<br />
Change in value adjustment –9<br />
Exchange rate differences –465<br />
Balance, 31 December 16,962<br />
2 Included in the consolidated financial statements under ‘‘tangible fixed assets”<br />
after subtracting deferred profit recognition.<br />
59