- Page 1 and 2:
FINAL REPORT Scientific Understandi
- Page 3 and 4:
This report was prepared under cont
- Page 5 and 6:
List of Acronyms AES Atomic Emissio
- Page 7 and 8:
List of Figures Figure 1.1. Figure
- Page 9 and 10:
Figure 1.21. Figure 1.22. Figure 1.
- Page 11 and 12:
Figure 1.38. Figure 1.39. Figure 1.
- Page 13 and 14:
Figure 2.26. Figure 2.27. Figure 2.
- Page 15 and 16:
Figure 3.11. Cathodic polarization
- Page 17 and 18:
Figure 3.31. Figure 3.32. Figure 3.
- Page 19 and 20:
Figure 4.12. Average Roughness of R
- Page 21 and 22:
Figure 5.4. Figures 5.5. Apparatus
- Page 23 and 24:
Figure 5.36. Figure 5.37. R paramet
- Page 25 and 26:
Figure 6.23. Two commercial samples
- Page 27 and 28:
Figure 7.1. a) instrumental configu
- Page 29 and 30:
List of Tables Table 1.1. Table 1.2
- Page 31 and 32:
Table 6.4. Processing parameters fo
- Page 33 and 34:
Keywords 1. Al alloys 2. Non-chroma
- Page 35 and 36:
1. Executive Summary This report su
- Page 37 and 38:
the role of electrophoresis in inhi
- Page 39 and 40:
occurring at low pHs and release at
- Page 41 and 42:
were obtained by a post treatment w
- Page 43 and 44:
4. G.O. Ilevbare, J.R. Scully, J. Y
- Page 45 and 46:
3. Objective The primary objective
- Page 47 and 48:
5. Results and Accomplishments In t
- Page 49 and 50:
powder, slurried with ultrapure wat
- Page 51 and 52:
TCP-coated AA2024-T3. A Kratos AXIS
- Page 53 and 54:
X-ray Photoelectron Spectroscopy (X
- Page 55 and 56:
Potential (V vs. Ag/AgCl) -0.2 -0.3
- Page 57 and 58:
Signal Intensity (counts/s) assessi
- Page 59 and 60:
Al (including both Al 0 and Al 3+ c
- Page 61 and 62:
TEM or during sample preparation, s
- Page 63 and 64:
Potential (V vs. Ag/AgCl) and uncoa
- Page 65 and 66:
5.1.4.8 Effects of Aging on the Fil
- Page 67 and 68:
Intensity (counts/s) Concentration
- Page 69 and 70:
|Z| 0.01Hz (ohm cm 2 ) |Z| 0.01Hz (
- Page 71 and 72:
The artificial scratch cell was als
- Page 73 and 74:
Raman intensity, a.u. 4000 880 3500
- Page 75 and 76:
Figure 1.24. Raman spectra for the
- Page 77 and 78:
peak at 520 cm -1 and an intense Cr
- Page 79 and 80:
Figure 1.28. Plots of the intensity
- Page 81 and 82:
Figure 1.30. (A) Video micrograph o
- Page 83 and 84:
The Zr and O signals arise from the
- Page 85 and 86:
Figure 1.35. (A) Corrosion potentia
- Page 87 and 88:
Table 1.1. Corrosion current (i cor
- Page 89 and 90:
additional pitting. The TCP coating
- Page 91 and 92:
Figure 1.41. Cr(VI) peak intensity
- Page 93 and 94:
Work is ongoing to understand how t
- Page 95 and 96:
9. L. Li, D-Y. Kim and G. M. Swain,
- Page 97 and 98:
carefully rinsed with DI water, air
- Page 99 and 100:
decrease to a net anodic current in
- Page 101 and 102:
Potential (mV vs. SCE) Potential (m
- Page 103 and 104:
i (A/cm 2 ) Immediately after silic
- Page 105 and 106:
Potential (mV vs. SCE) Potential (m
- Page 107 and 108:
Potential (mV vs. SCE) Rp (ohm.cm 2
- Page 109 and 110:
Potential (mV vs. SCE) Potential (m
- Page 111 and 112:
2.4.4 In situ AFM Scratching Result
- Page 113 and 114:
Figure 2.31. In situ AFM scratching
- Page 115 and 116:
(2.3) Figure 2.35. Specie diagram f
- Page 117 and 118:
concentration and the silicon to ca
- Page 119 and 120:
analysis coupled with XPS revealed
- Page 121 and 122:
5.2.4.4 In Situ AFM Scratching Befo
- Page 123 and 124:
esults in the formation of silicate
- Page 125 and 126:
26. P. Schmutz and G.S. Frankel, J.
- Page 127 and 128:
Pr 3+ , Y 3+ showed [12] an order o
- Page 129 and 130:
0.1M NaCl solution with varying con
- Page 131 and 132:
8.7 through pH 12.6 due to the lowe
- Page 133 and 134:
(b) (c) 99
- Page 135 and 136:
immersed in Ce 3+ remained bright w
- Page 137 and 138:
S phase and dissolution of Al matri
- Page 139 and 140:
Corrosion rate, i corr (A/cm 2 ) 6x
- Page 141 and 142:
I L (microA) 600 500 400 300 NC (-8
- Page 143 and 144:
than that of chromate[35]. Historic
- Page 145 and 146:
coupon was immersed with the polish
- Page 147 and 148:
5.3.2.4 Results 5.3.2.4.1 Speciatio
- Page 149 and 150:
(c) Figure 3.8. Speciation diagram
- Page 151 and 152:
E vs. SCE (V) -0.70 -0.75 -0.80 -0.
- Page 153 and 154:
E vs. SCE (V) 1000 rpm E vs. SCE (V
- Page 155 and 156:
Chemical quantification showed a me
- Page 157 and 158:
(a) (b) Figure 3.15. (a) (top) SEM
- Page 159 and 160:
E vs. SCE (V) E vs. SCE (V) E vs. S
- Page 161 and 162:
-Z" (ohm) -Z" (ohm) -Z" (ohm) -Z" (
- Page 163 and 164:
(Figure 3.8b). However, no effect o
- Page 165 and 166:
CPS CPS CPS x 2 14 10 12 10 8 6 4 2
- Page 167 and 168:
CPS CPS 100 95 90 85 80 75 70 x 10
- Page 169 and 170:
I k L 0. 2 1 2 AnFC B D 2 3 O 1
- Page 171 and 172:
i -800 (A/cm 2 ) 10 -4 NaCl NaCl+5
- Page 173 and 174:
Corrosion rate ( 1/R p ) ohm -1 cm
- Page 175 and 176:
particles compared to zinc-free sol
- Page 177 and 178:
and Zn bentonite compounds have red
- Page 179 and 180:
2) Deoxidizing for 3 minutes in an
- Page 181 and 182:
Scintag (now ThermoARL) Pad-V TM an
- Page 183 and 184:
Table 3.5. Characterization of bent
- Page 185 and 186:
Zn 2+ cation release (meq/100g) Pr
- Page 187 and 188:
(a) (b) (c) Figure 3.33. (a) An exp
- Page 189 and 190:
|Z| (ohm) Phase angle (degrees) 5.3
- Page 191 and 192:
|Z| at 0.01 Hz (ohm.cm 2 ) Pore Res
- Page 193 and 194:
|Z| at 0.01 Hz (ohm.cm 2 ) |Z| at 0
- Page 195 and 196:
pigmented coatings exhibited partia
- Page 197 and 198:
5.3.3.6 Conclusions 1. Exchange ben
- Page 199 and 200:
39. M. Mahdavian and M. M. Attar, P
- Page 201 and 202:
100. F.Liebau, Structural Chemistry
- Page 203 and 204:
of the coated sample, which is tigh
- Page 205 and 206:
Lubricant Blue (Struers) was used f
- Page 207 and 208:
good grip on the dolly, the equipme
- Page 209 and 210:
Pressure (kPa) r (mm) Pressure x Ra
- Page 211 and 212:
Pressure x Radius (kN/m) plateau bu
- Page 213 and 214:
Pressure x Radius (kN/m) Pxr (KN/m)
- Page 215 and 216:
Average Roughness (m) In contrast,
- Page 217 and 218:
Adhesion Strength (J/m 2 ) PVB PVB
- Page 219 and 220:
Pressure (kPa) Constant Infusion up
- Page 221 and 222:
(a) (b) (c) (d) Figure 4.19. Coatin
- Page 223 and 224:
Min. Potential (V vs SHE) Min. Pote
- Page 225 and 226:
Pressure (kPa) exposure in hot wate
- Page 227 and 228:
Engineering Stress (MPa) slope of t
- Page 229 and 230:
Adhesion Strength (J/m 2 ) ASTM D33
- Page 231 and 232:
Pressure (kPa) Pressure (kPa) Radiu
- Page 233 and 234:
Adhesion Strength (J/m 2 ) Pressure
- Page 235 and 236:
Table 4.7. Adhesion Strength values
- Page 237 and 238:
Non-Cl./Deox. No CC Cleaned/Deox. N
- Page 239 and 240:
5.4.5 Conclusions and Implications
- Page 241 and 242:
5.5 Task 5: Inhibitor Activation an
- Page 243 and 244:
solution for equilibration at contr
- Page 245 and 246:
Table 5.2. Techniques applied to sp
- Page 247 and 248: The capacitance was determined by E
- Page 249 and 250: combination with zinc molybdate, a
- Page 251 and 252: Concentration, mmol / L Final pH te
- Page 253 and 254: Alkaline affects praseodymium solub
- Page 255 and 256: MoO 4 2- ) inhibition to the system
- Page 257 and 258: Zinc molybdate is reported to be si
- Page 259 and 260: The presence of a salt that has no
- Page 261 and 262: This approach yields two figures of
- Page 263 and 264: Inhibitor mapping of the Hentzen 16
- Page 265 and 266: The molybdate loss in the strontium
- Page 267 and 268: The capacitance dC is given by 0 (
- Page 269 and 270: 2 C( r, t) C( r )[1 r 2 exp( D nt
- Page 271 and 272: -thea (degree) logIZI (Ohm-Cm 2 ) P
- Page 273 and 274: Capacitance (F) respectively. The c
- Page 275 and 276: Capacitance (F) Weight gain (g) For
- Page 277 and 278: Normalized Capacitance Change Norma
- Page 279 and 280: Potential V (Ag/AgCl) Corrosion rat
- Page 281 and 282: 5.5.4.7 Nanopore structure characte
- Page 283 and 284: Normaalized Transport Rate (g/m^2_d
- Page 285 and 286: S-Parameter S-Parameter Penetration
- Page 287 and 288: S-Parameter S-Parameter Penetration
- Page 289 and 290: R-parameter R-parameter Penetration
- Page 291 and 292: 5. T. M. Letcher, “Thermodynamics
- Page 293 and 294: pigment of CaSiO 3 with initial pH
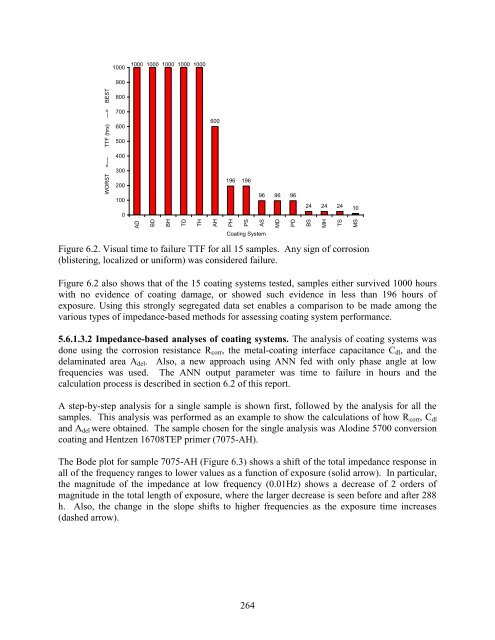
- Page 295 and 296: allowed a comparison of the differe
- Page 297: The solution resistance (R sol ) va
- Page 301 and 302: C [F/cm2] Rcorr [ohm*cm2] 7075-AHN
- Page 303 and 304: C [F/cm 2 ] Rcorr [ohm*cm 2 ] Rcorr
- Page 305 and 306: Visual TTF [hours] Table 6.2. Param
- Page 307 and 308: of Metallast pre-treatment, which h
- Page 309 and 310: Prediction of the TTF obtained by A
- Page 311 and 312: 5.6.2 Electrochemical Impedance Spe
- Page 313 and 314: 5.6.2.2.1 Coating system descriptio
- Page 315 and 316: Table 6.4. Processing parameters fo
- Page 317 and 318: population of total TTF vectors th
- Page 319 and 320: components of the impedance and the
- Page 321 and 322: Figure 6.17. EIS spectra for sample
- Page 323 and 324: Figure 6.18. Kaplan-Meier survival
- Page 325 and 326: Maximum c i range Maximum ci range
- Page 327 and 328: The type and number of input neuron
- Page 329 and 330: Predicted TTF The BFM method, intro
- Page 331 and 332: The most significant variables to i
- Page 333 and 334: 5.6.3 Characterization of Pigment D
- Page 335 and 336: of sputtering gold and carbon paint
- Page 337 and 338: Figure 6.26. Cross-sectional view o
- Page 339 and 340: Figure 6.28. EDX maps of primer cro
- Page 341 and 342: Figure 6.31. EDX maps of primer cro
- Page 343 and 344: In Figure 6.34, Ca and Si existed a
- Page 345 and 346: Table 6.8. Average percentage resid
- Page 347 and 348: strictly limited due to the barrier
- Page 349 and 350:
Figure 6.37. Coating systems in det
- Page 351 and 352:
Each corrosion volume of scribed ar
- Page 353 and 354:
Corrosion Area (mm 2 ) 1200 1000 80
- Page 355 and 356:
Corrosion Area (mm 2 ) Corrosion Ra
- Page 357 and 358:
Corrosion Rate (mm/yr) Corrosion Vo
- Page 359 and 360:
Corrosion Area (mm 2 ) corrosion ra
- Page 361 and 362:
corrosion rate (mm/yr) Corrosion Vo
- Page 363 and 364:
Corrosion Volume (mm/yr) Corrosion
- Page 365 and 366:
ate, PPG CA7233 coated samples had
- Page 367 and 368:
Appendix 6B Table 6B.1. Corrosion v
- Page 369 and 370:
Table 6B.3. Corrosion rate of sampl
- Page 371 and 372:
Table 6B.5. Corrosion area of sampl
- Page 373 and 374:
5.7. Task 7: Characterization of Lo
- Page 375 and 376:
at 65C. After using DI water to rin
- Page 377 and 378:
Transmission Mode Conduct EIS measu
- Page 379 and 380:
Cdl(F/cm 2 ) Rp(.cm 2 ) relatively
- Page 381 and 382:
pit bottom area (cm 2 ) pit bottom
- Page 383 and 384:
2days 2days 1mm 1mm 7days 7days Pit
- Page 385 and 386:
(a) (b) Si Si O Al Na Ca K Si Al-Cu
- Page 387 and 388:
Pit 1 and pit 2 as shown in Figure
- Page 389 and 390:
In these experiments, Deft primers
- Page 391 and 392:
For the case of as-deposited thin f
- Page 393 and 394:
3. L. Balazs, Physica E, 54, 1183-1
- Page 395 and 396:
and subsequently re-oxidized in two
- Page 397 and 398:
not represent true adhesion strengt
- Page 399 and 400:
• The pit morphology in 0.5 M NaC
- Page 401 and 402:
Appendix 2. List of Scientific/Tech
- Page 403 and 404:
“The Secret Life of Chromate Free


